Querier 组件
现在我们就创建成功了两个 Prometheus 实例,但是我们真正去使用的时候并不是像上面提到的在前面加一个负载均衡器去查询监控数据,而是使用 Thanos 的 Querier 组件来提供一个全局的统一查询入口。对于 Quierier 最重要的就是要配置上 Thanos 的 Sidecar 地址,我们这里完全可以直接使用 Headless Service 去自动发现:
# thanos-querier.yaml
apiVersion: apps/v1
kind: Deployment
metadata:
  name: thanos-querier
  namespace: kube-mon
  labels:
    app: thanos-querier
spec:
  replicas: 2
  selector:
    matchLabels:
      app: thanos-querier
  template:
    metadata:
      labels:
        app: thanos-querier
    spec:
      affinity:
        podAntiAffinity:
          preferredDuringSchedulingIgnoredDuringExecution:
            - weight: 100
              podAffinityTerm:
                topologyKey: kubernetes.io/hostname
                labelSelector:
                  matchExpressions:
                    - key: app
                      operator: In
                      values:
                        - thanos-querier
      containers:
        - name: thanos
          image: thanosio/thanos:v0.25.1
          args:
            - query
            - --log.level=debug
            - --query.replica-label=replica
            # Discover local store APIs using DNS SRV.
            - --store=dnssrv+thanos-store-gateway:10901
          ports:
            - name: http
              containerPort: 10902
            - name: grpc
              containerPort: 10901
          resources:
            requests:
              memory: 512Mi
              cpu: 500m
            limits:
              memory: 512Mi
              cpu: 500m
          livenessProbe:
            httpGet:
              path: /-/healthy
              port: http
            initialDelaySeconds: 10
          readinessProbe:
            httpGet:
              path: /-/healthy
              port: http
            initialDelaySeconds: 15
---
apiVersion: v1
kind: Service
metadata:
  name: thanos-querier
  namespace: kube-mon
  labels:
    app: thanos-querier
spec:
  ports:
    - port: 9090
      targetPort: http
      name: http
  selector:
    app: thanos-querier
  type: NodePort
容器中的参数 --store=dnssrv+thanos-store-gateway:10901 可以帮助自动发现可以查询指标数据的所有组件;然后创建一个 thanos-querier 的 Serivce 对象可以来提供一个运行 PromQL 的 web 页面,也提供了一个是否对不同集群数据进行去重的入口。直接创建上面的对象:
☸ ➜ kubectl apply -f https://p8s.io/docs/thanos/manifests/thanos-querier.yaml
☸ ➜ kubectl get pods -n kube-mon -l app=thanos-querier
NAME                             READY   STATUS    RESTARTS   AGE
thanos-querier-cf566866b-r4jcj   1/1     Running   0          3m26s
☸ ➜ kubectl get svc -n kube-mon -l app=thanos-querier
NAME             TYPE       CLUSTER-IP      EXTERNAL-IP   PORT(S)          AGE
thanos-querier   NodePort   10.110.193.50   <none>        9090:31278/TCP   5m11s
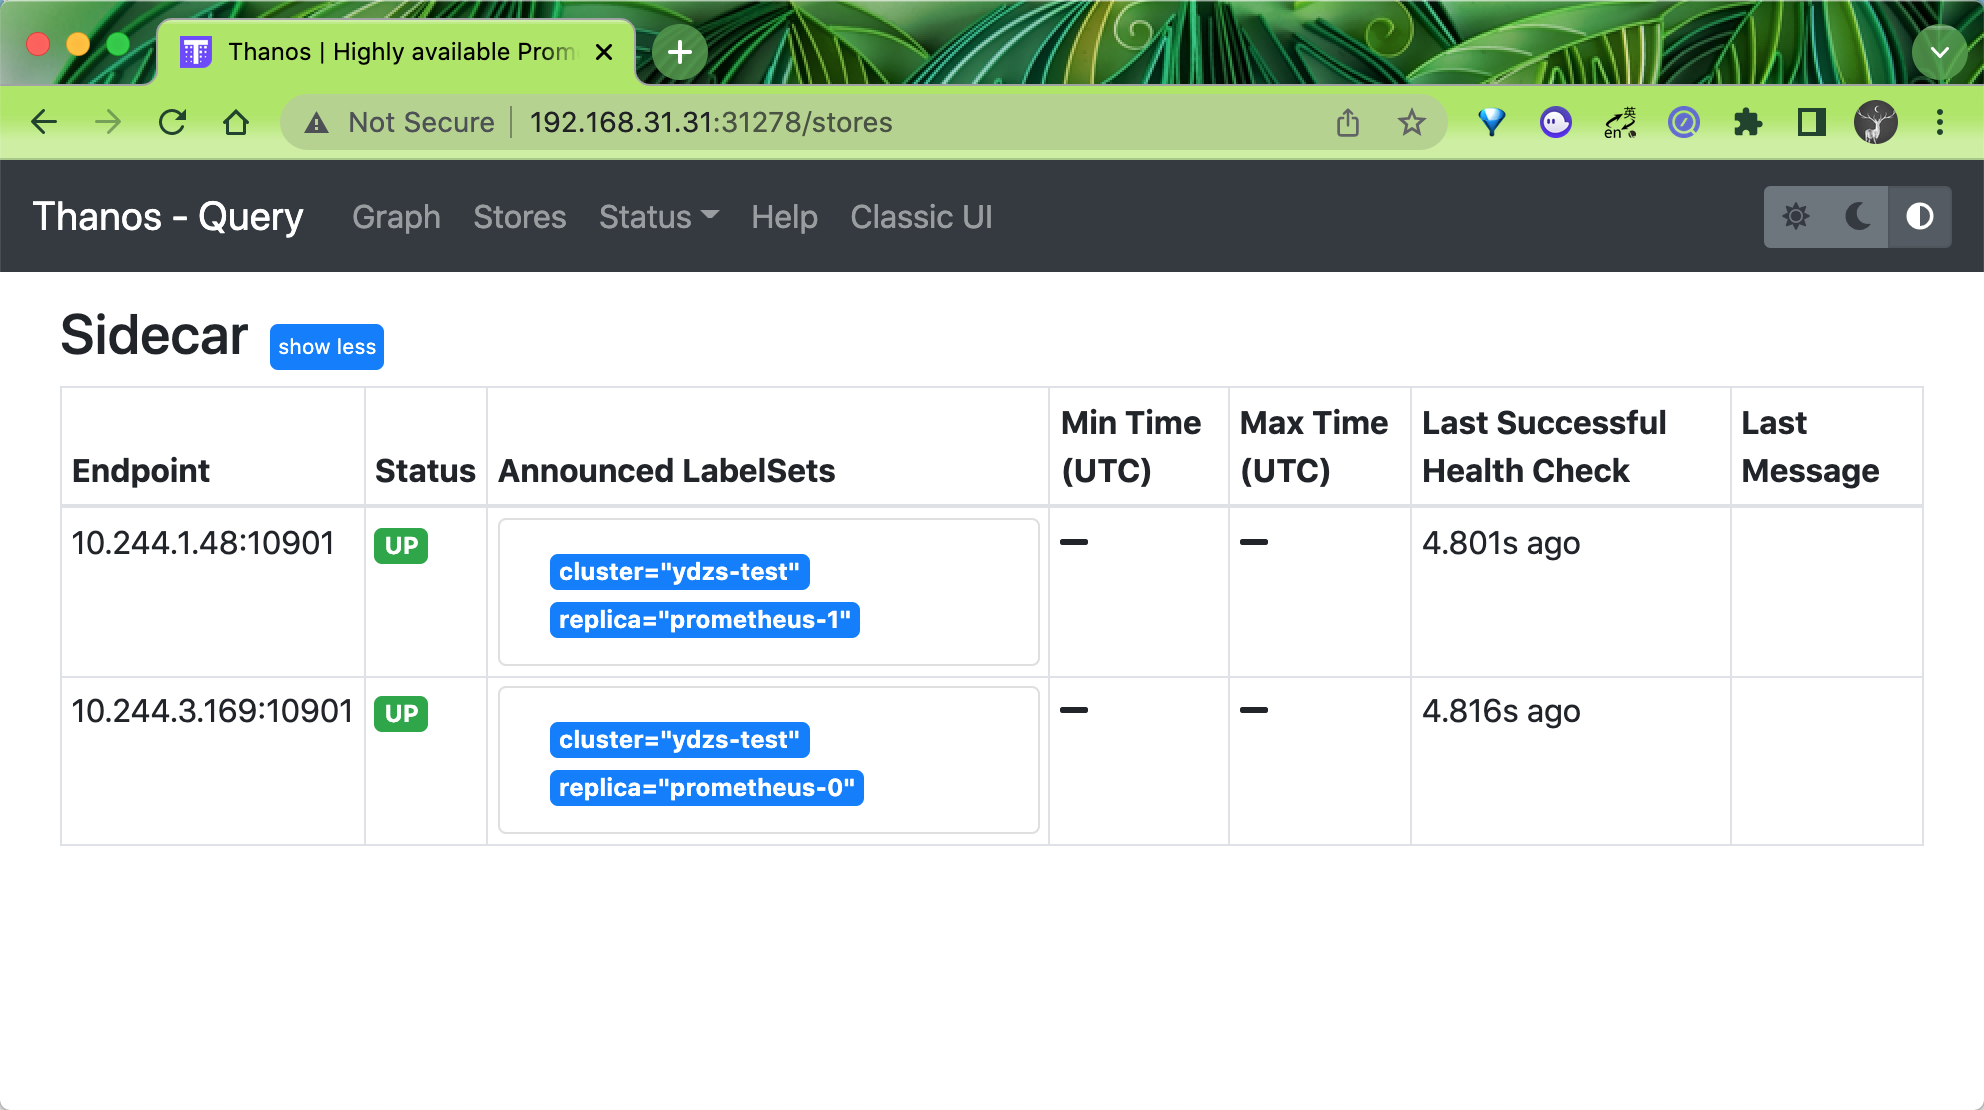
部署完成后我们就可以通过 http://<任意节点IP>:31278 去访问 Querier 了,在 Stores 页面下面就会显示通过服务发现获取到的 Sidecar 信息:
在 Graph 页面下同样可以去使用 PromQL 语句来查询监控信息,这个页面和 Prometheus 原生的页面几乎是一致的,比如我们查询 master 节点的负载信息:
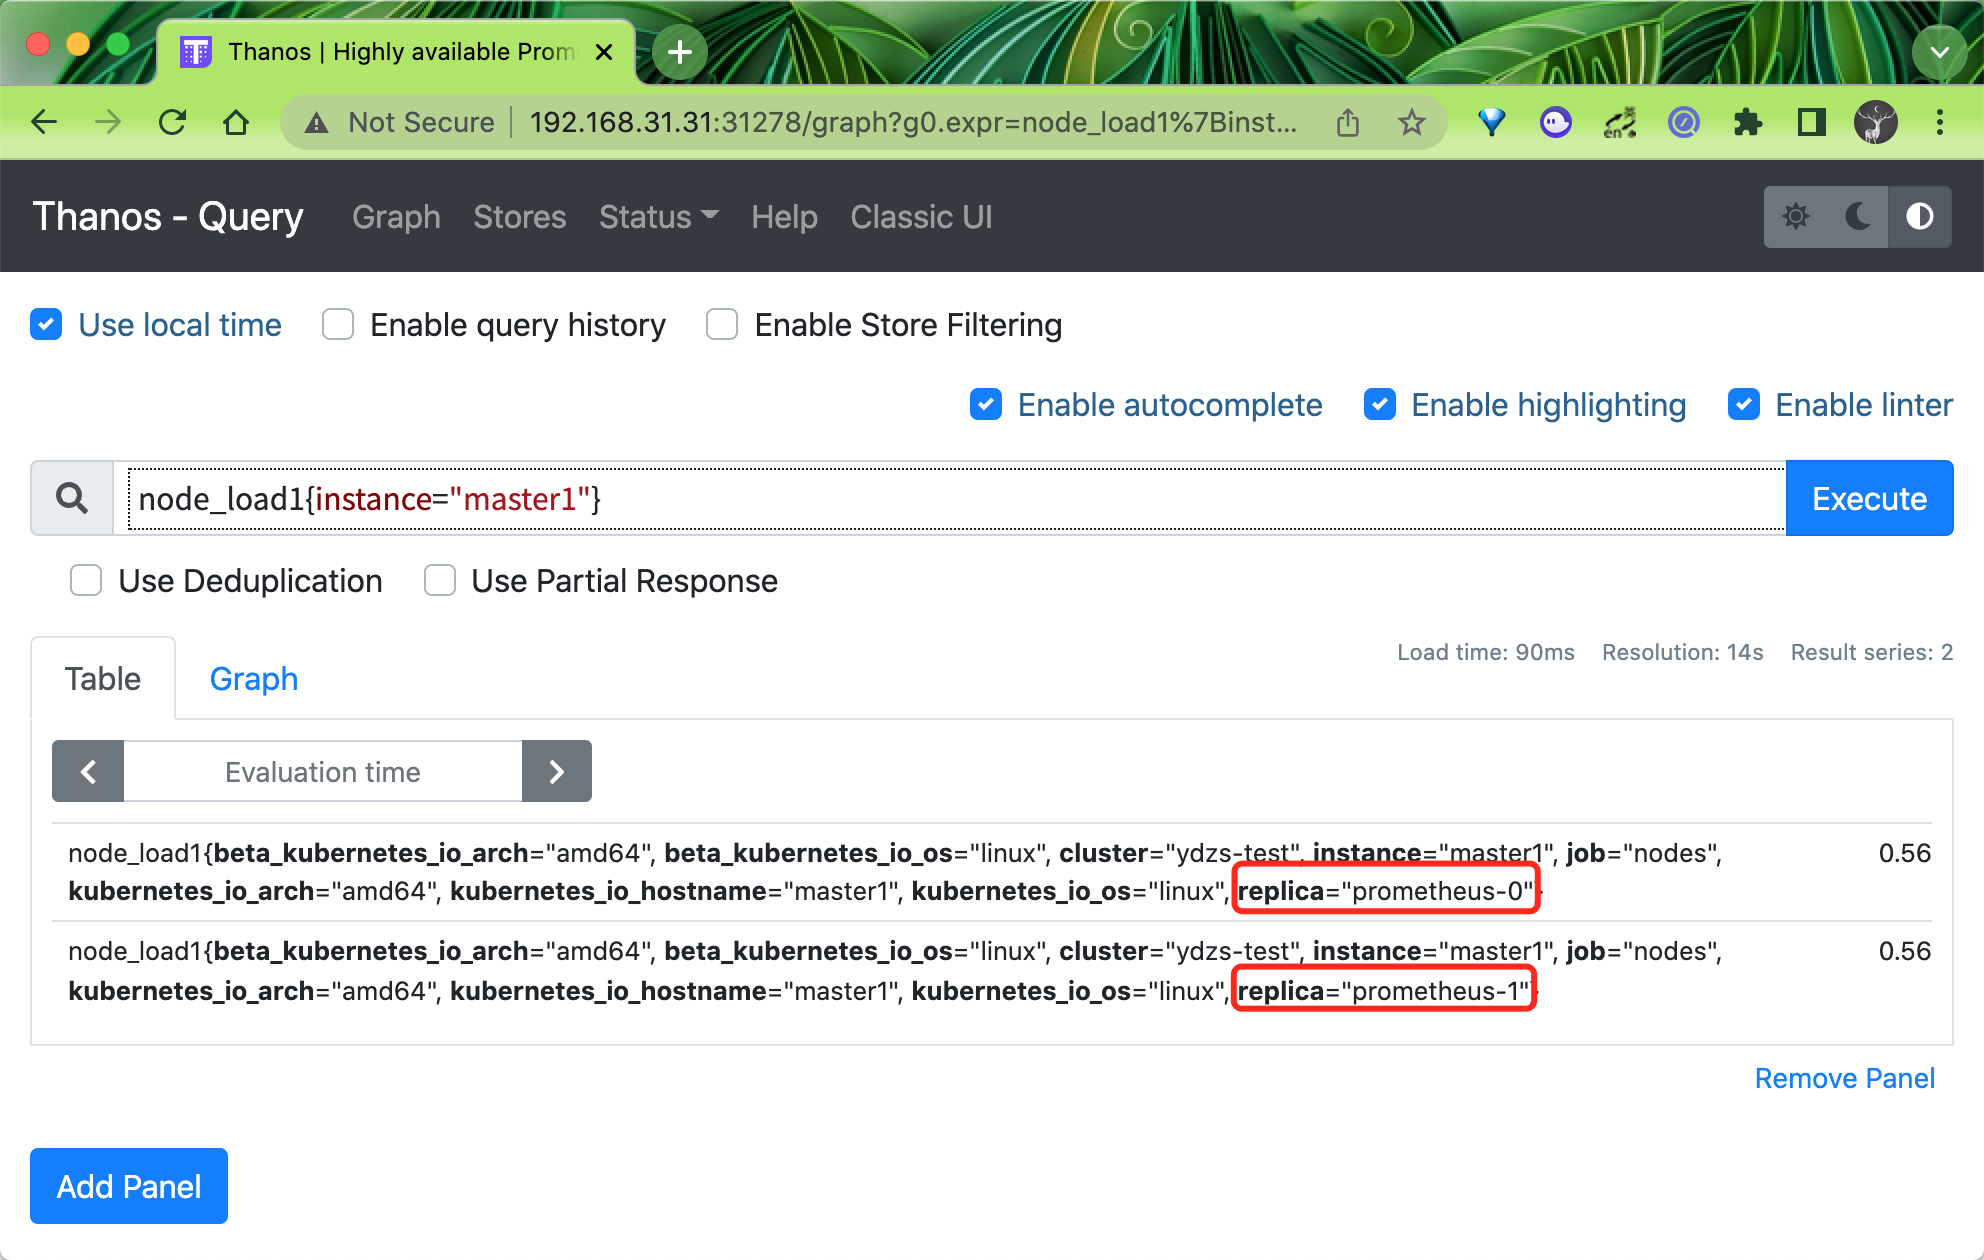
这里我没有勾上 deduplication,所以 Thanos 不会帮我合并数据,所以能够看到 prometheus-0 和 prometheus-1 两条数据,因为我们有两个副本去抓取监控数据。
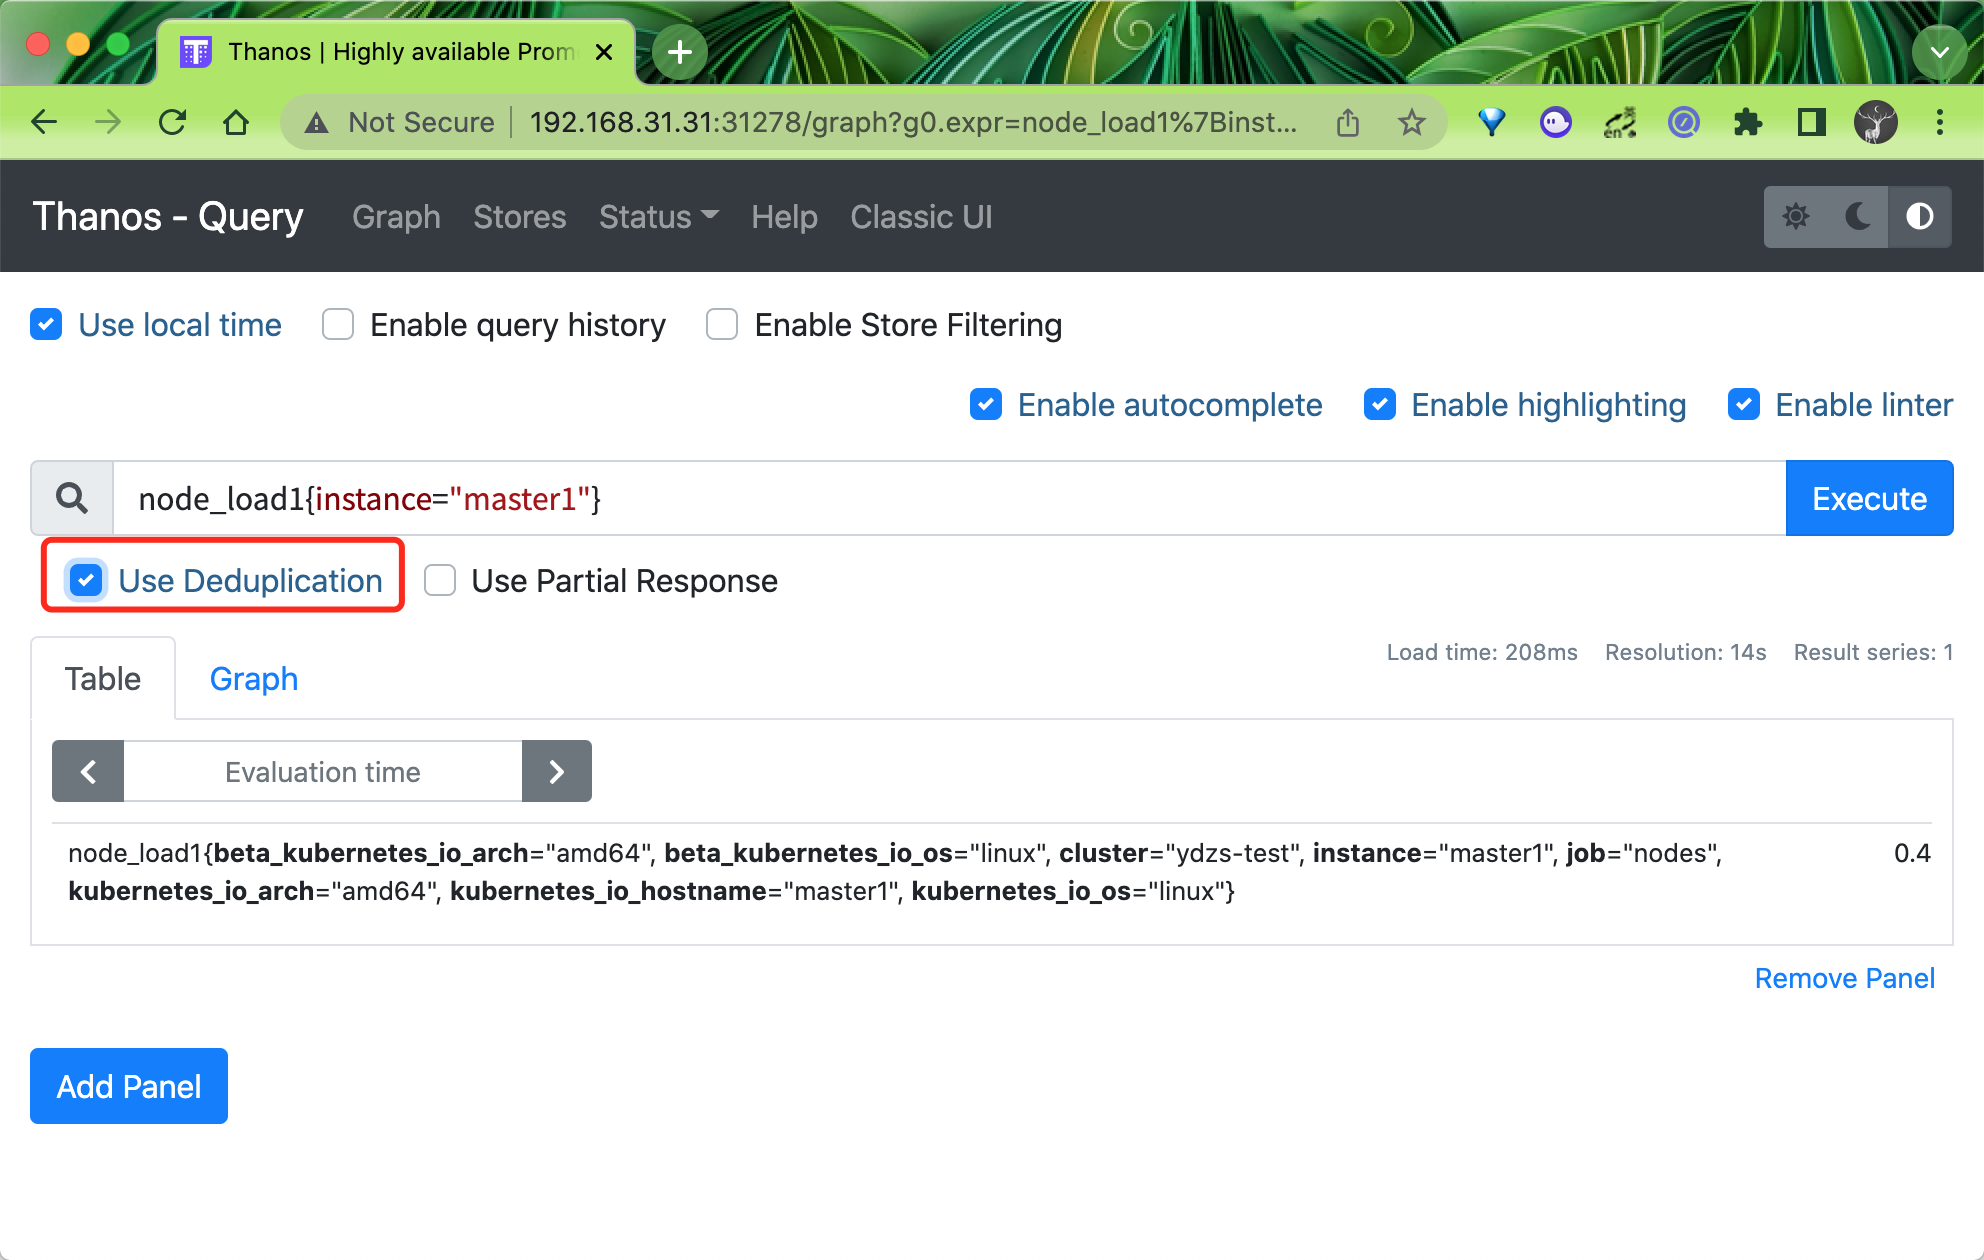
如果将 deduplication 选中,结果会根据 replica 这个标签进行合并,如果两个副本都有对应的数据,Querier 会取 timestamp 更小的结果:
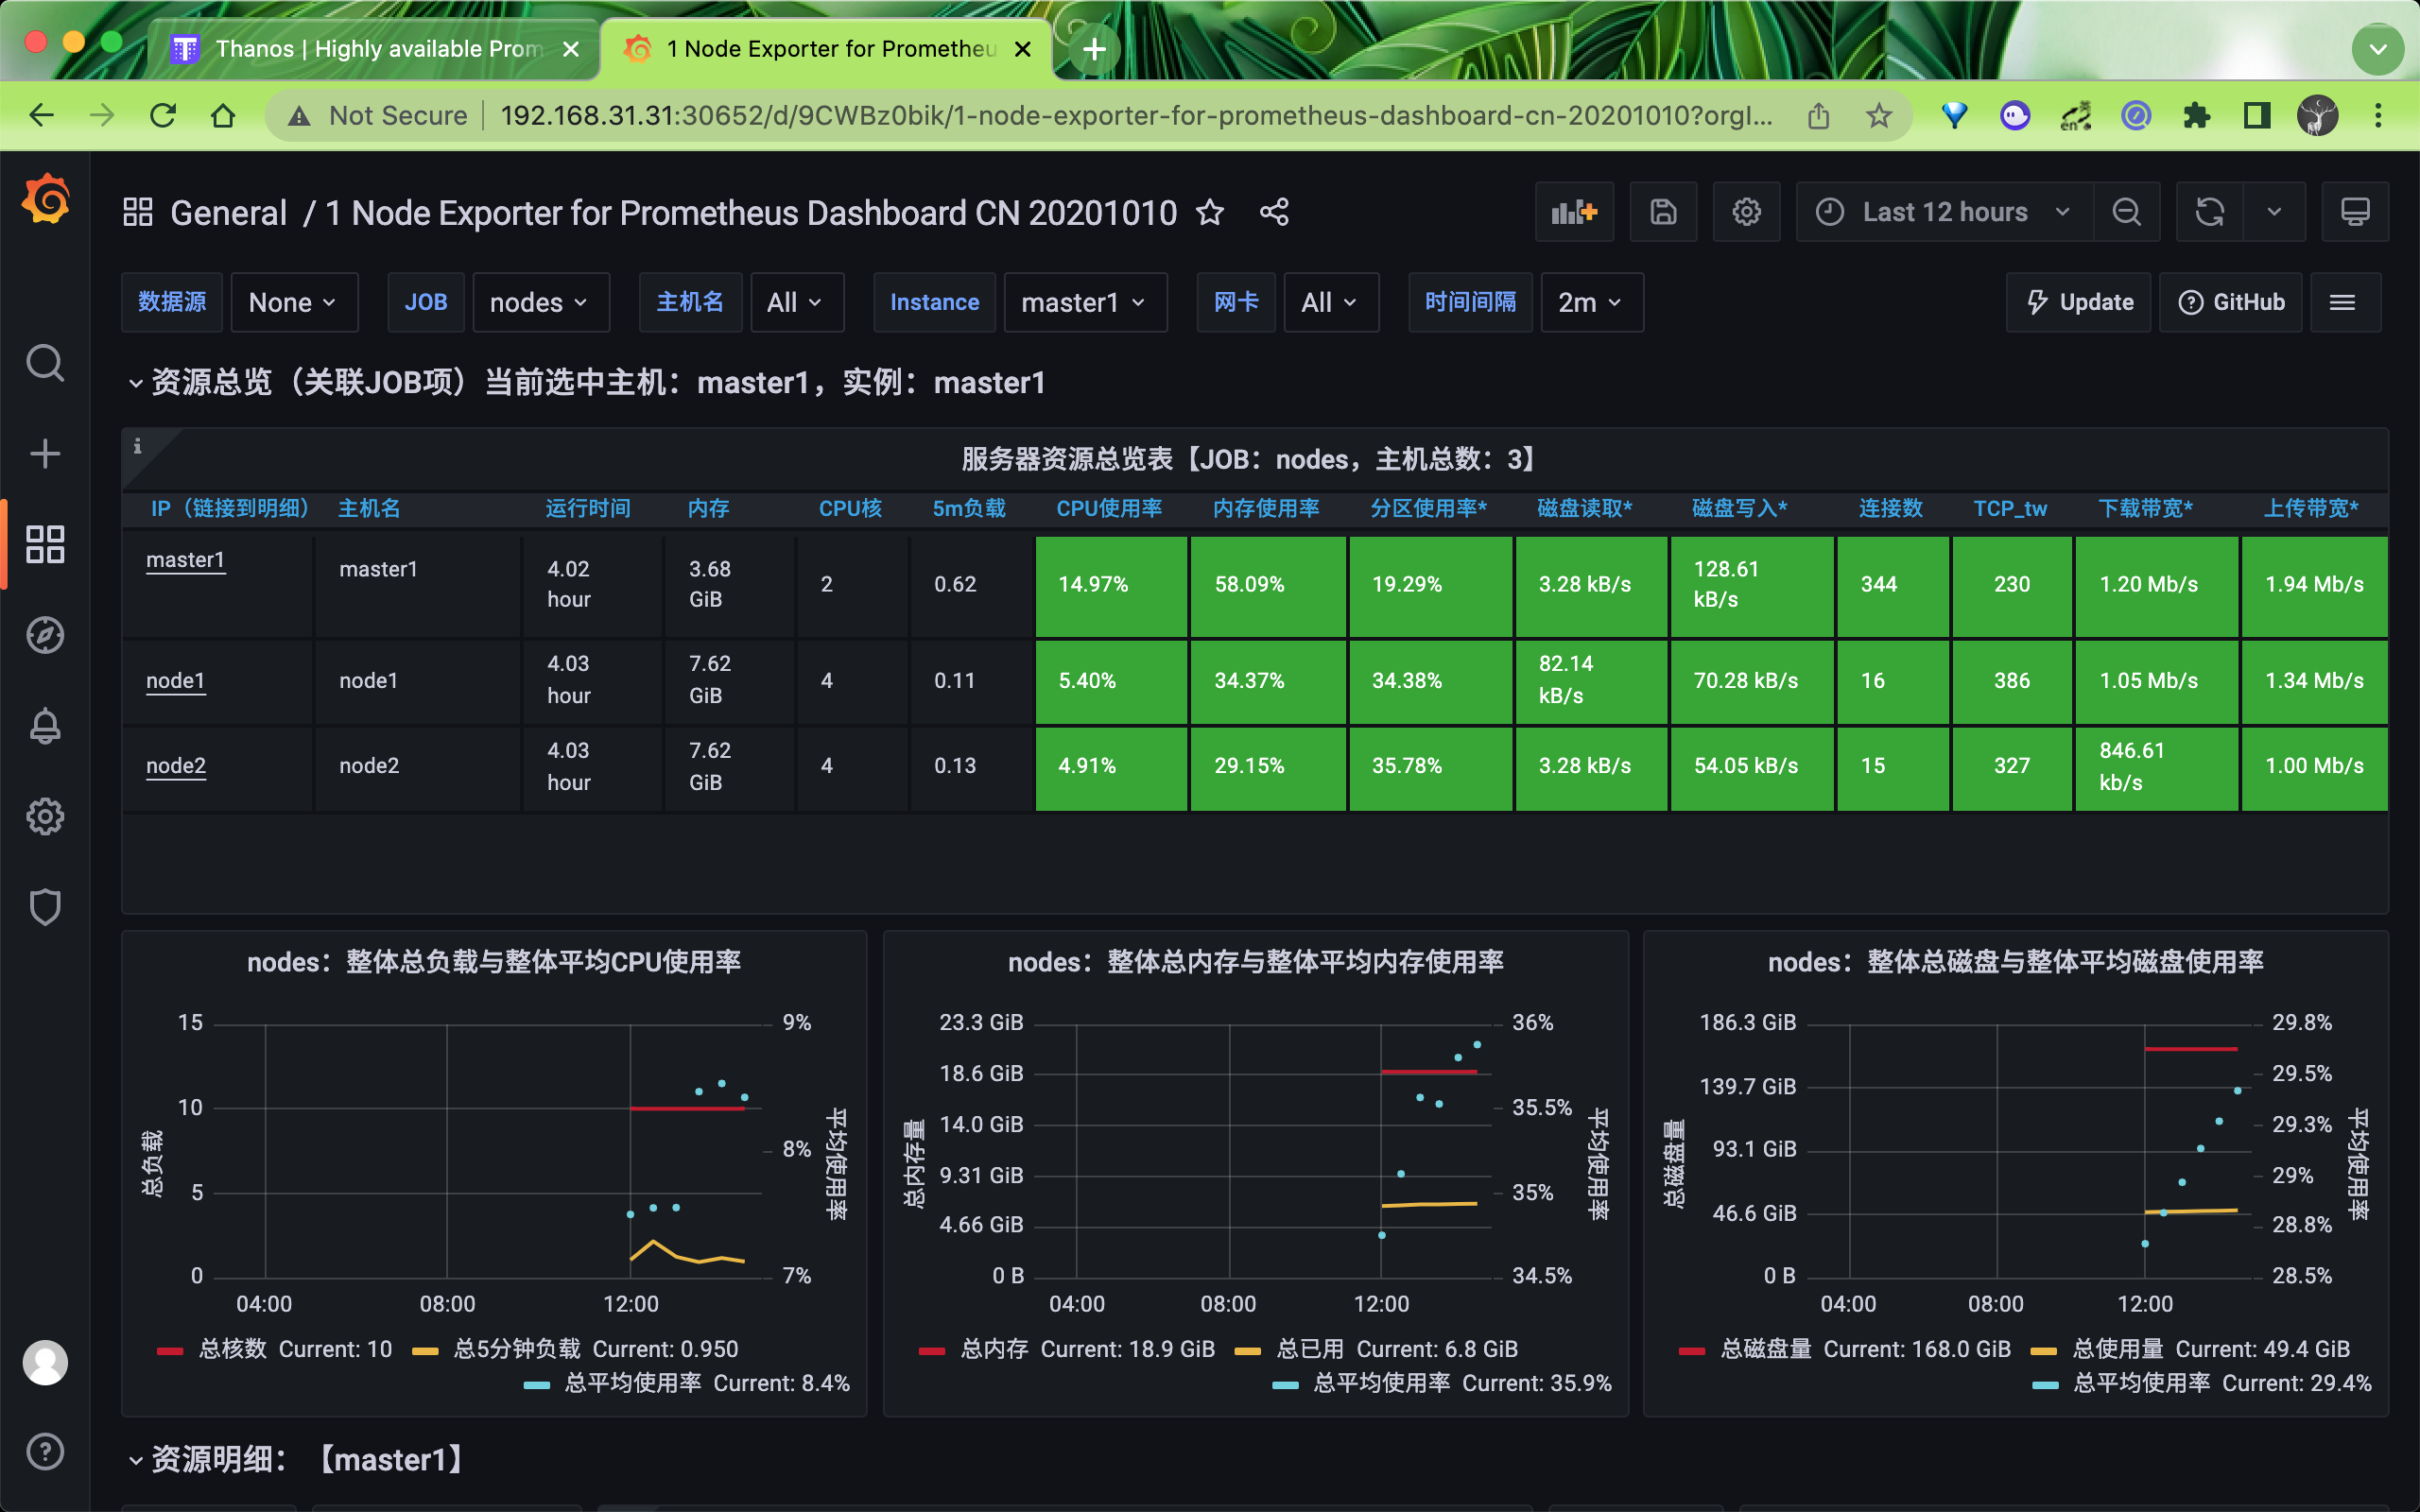
当然这个时候我们在前面章节中 Grafana 里面配置的 Prometheus 的数据源也就失效了,因为现在监控数据的来源是 Thanos Querier,所以我们需要重新配置 Prometheus 的数据源地址为 http://thanos-querier:9090:

之前的监控图表也可以正常显示了: