HPA 控制器
在前面的学习中我们使用了一个 kubectl scale 命令可以来实现 Pod 的扩缩容功能,但是这个是完全手动操作的,要应对线上的各种复杂情况,我们需要能够做到自动化去感知业务,来自动进行扩缩容。为此,Kubernetes 也为我们提供了这样的一个资源对象:Horizontal Pod Autoscaling(Pod 水平自动伸缩),简称 HPA,HPA 通过监控分析一些控制器控制的所有 Pod 的负载变化情况来确定是否需要调整 Pod 的副本数量,这是 HPA 最基本的原理:
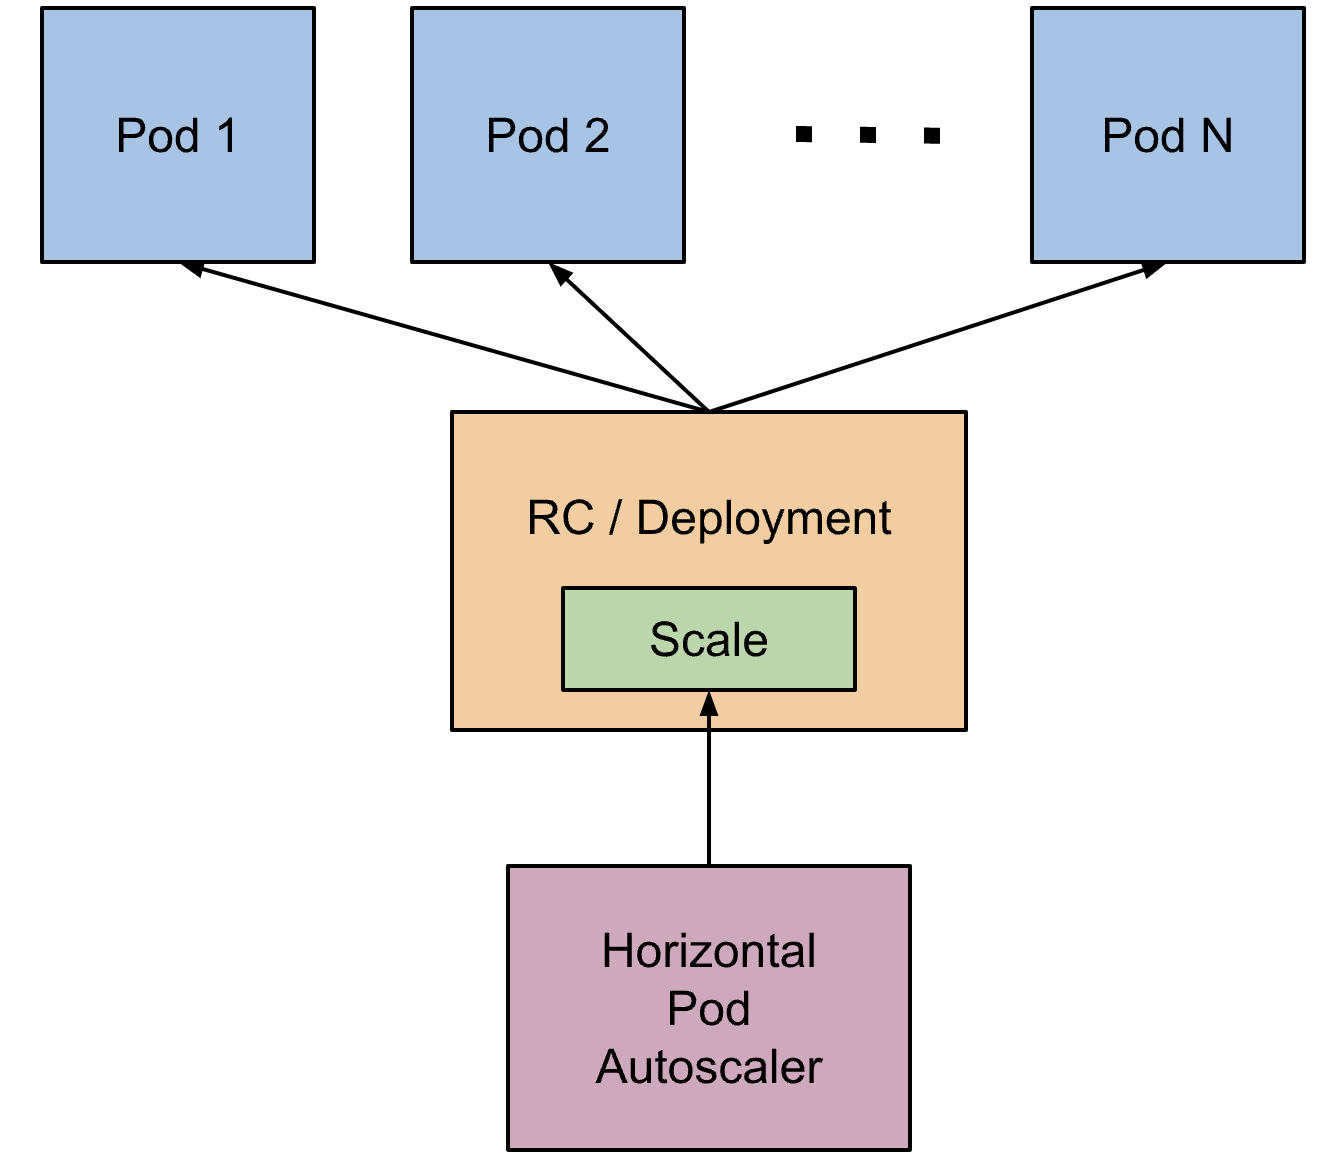
我们可以简单的通过 kubectl autoscale 命令来创建一个 HPA 资源对象,HPA Controller 默认30s轮询一次(可通过 kube-controller-manager 的--horizontal-pod-autoscaler-sync-period 参数进行设置),查询指定的资源中的 Pod 资源使用率,并且与创建时设定的值和指标做对比,从而实现自动伸缩的功能。
Metrics Server
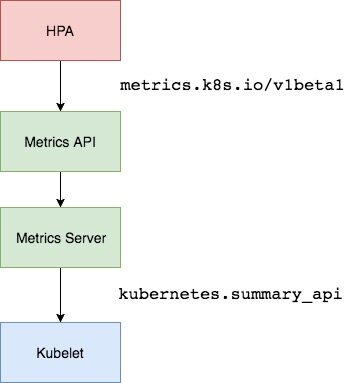
在 HPA 的第一个版本中,我们需要 Heapster 提供 CPU 和内存指标,在 HPA v2 过后就需要安装 Metrcis Server 了,Metrics Server 可以通过标准的 Kubernetes API 把监控数据暴露出来,有了 Metrics Server 之后,我们就完全可以通过标准的 Kubernetes API 来访问我们想要获取的监控数据了:
https://10.96.0.1/apis/metrics.k8s.io/v1beta1/namespaces/<namespace-name>/pods/<pod-name>
比如当我们访问上面的 API 的时候,我们就可以获取到该 Pod 的资源数据,这些数据其实是来自于 kubelet 的 Summary API 采集而来的。不过需要说明的是我们这里可以通过标准的 API 来获取资源监控数据,并不是因为 Metrics Server 就是 APIServer 的一部分,而是通过 Kubernetes 提供的 Aggregator 汇聚插件来实现的,是独立于 APIServer 之外运行的。
聚合 API
Aggregator 允许开发人员编写一个自己的服务,把这个服务注册到 Kubernetes 的 APIServer 里面去,这样我们就可以像原生的 APIServer 提供的 API 使用自己的 API 了,我们把自己的服务运行在 Kubernetes 集群里面,然后 Kubernetes 的 Aggregator 通过 Service 名称就可以转发到我们自己写的 Service 里面去了。这样这个聚合层就带来了很多好处:
- 增加了 API 的扩展性,开发人员可以编写自己的 API 服务来暴露他们想要的 API。
- 丰富了 API,核心 kubernetes 团队阻止了很多新的 API 提案,通过允许开发人员将他们的 API 作为单独的服务公开,这样就无须社区繁杂的审查了。
- 开发分阶段实验性 API,新的 API 可以在单独的聚合服务中开发,当它稳定之后,在合并会 APIServer 就很容易了。
- 确保新 API 遵循 Kubernetes 约定,如果没有这里提出的机制,社区成员可能会被迫推出自己的东西,这样很可能造成社区成员和社区约定不一致。
安装
所以现在我们要使用 HPA,就需要在集群中安装 Metrics Server 服务,要安装 Metrics Server 就需要开启 Aggregator,因为 Metrics Server 就是通过该代理进行扩展的,不过我们集群是通过 Kubeadm 搭建的,默认已经开启了,如果是二进制方式安装的集群,需要单独配置 kube-apsierver 添加如下所示的参数:
--requestheader-client-ca-file=<path to aggregator CA cert>
--requestheader-allowed-names=aggregator
--requestheader-extra-headers-prefix=X-Remote-Extra-
--requestheader-group-headers=X-Remote-Group
--requestheader-username-headers=X-Remote-User
--proxy-client-cert-file=<path to aggregator proxy cert>
--proxy-client-key-file=<path to aggregator proxy key>
如果 kube-proxy 没有和 APIServer 运行在同一台主机上,那么需要确保启用了如下 kube-apsierver 的参数:
--enable-aggregator-routing=true
对于这些证书的生成方式,我们可以查看官方文档:https://github.com/kubernetes-sigs/apiserver-builder-alpha/blob/master/docs/concepts/auth.md。
Aggregator 聚合层启动完成后,就可以来安装 Metrics Server 了,我们可以获取该仓库的官方安装资源清单:
# 官方仓库地址:https://github.com/kubernetes-sigs/metrics-server
➜  ~ wget https://github.com/kubernetes-sigs/metrics-server/releases/download/v0.5.1/components.yaml
在部署之前,修改 components.yaml 的镜像地址为:
hostNetwork: true # 使用hostNetwork模式
containers:
  - name: metrics-server
    image: cnych/metrics-server:v0.5.1
等部署完成后,可以查看 Pod 日志是否正常:
➜  ~ kubectl apply -f components.yaml
➜  ~ kubectl get pods -n kube-system -l k8s-app=metrics-server
NAME                              READY   STATUS    RESTARTS   AGE
metrics-server-6f667d74b6-6c9ps   0/1     Running   0          7m52s
➜  ~ manifests kubectl logs -f metrics-server-6f667d74b6-6c9ps -n kube-system
I1115 10:06:02.381541       1 serving.go:341] Generated self-signed cert (/tmp/apiserver.crt, /tmp/apiserver.key)
E1115 10:06:02.735837       1 scraper.go:139] "Failed to scrape node" err="Get \"https://192.168.31.31:10250/stats/summary?only_cpu_and_memory=true\": x509: cannot validate certificate for 192.168.31.31 because it doesn't contain any IP SANs" node="master1"
E1115 10:06:02.744967       1 scraper.go:139] "Failed to scrape node" err="Get \"https://192.168.31.108:10250/stats/summary?only_cpu_and_memory=true\": x509: cannot validate certificate for 192.168.31.108 because it doesn't contain any IP SANs" node="node1"
I1115 10:06:02.751391       1 requestheader_controller.go:169] Starting RequestHeaderAuthRequestController
I1115 10:06:02.751410       1 shared_informer.go:240] Waiting for caches to sync for RequestHeaderAuthRequestController
I1115 10:06:02.751413       1 configmap_cafile_content.go:202] Starting client-ca::kube-system::extension-apiserver-authentication::requestheader-client-ca-file
I1115 10:06:02.751397       1 configmap_cafile_content.go:202] Starting client-ca::kube-system::extension-apiserver-authentication::client-ca-file
I1115 10:06:02.751423       1 shared_informer.go:240] Waiting for caches to sync for client-ca::kube-system::extension-apiserver-authentication::requestheader-client-ca-file
I1115 10:06:02.751424       1 shared_informer.go:240] Waiting for caches to sync for client-ca::kube-system::extension-apiserver-authentication::client-ca-file
I1115 10:06:02.751473       1 dynamic_serving_content.go:130] Starting serving-cert::/tmp/apiserver.crt::/tmp/apiserver.key
I1115 10:06:02.751822       1 secure_serving.go:202] Serving securely on [::]:443
I1115 10:06:02.751896       1 tlsconfig.go:240] Starting DynamicServingCertificateController
E1115 10:06:02.756987       1 scraper.go:139] "Failed to scrape node" err="Get \"https://192.168.31.46:10250/stats/summary?only_cpu_and_memory=true\": x509: cannot validate certificate for 192.168.31.46 because it doesn't contain any IP SANs" node="node2"
I1115 10:06:02.851642       1 shared_informer.go:247] Caches are synced for client-ca::kube-system::extension-apiserver-authentication::requestheader-client-ca-file
I1115 10:06:02.851739       1 shared_informer.go:247] Caches are synced for RequestHeaderAuthRequestController
I1115 10:06:02.851748       1 shared_informer.go:247] Caches are synced for client-ca::kube-system::extension-apiserver-authentication::client-ca-file
E1115 10:06:17.742350       1 scraper.go:139] "Failed to scrape node" err="Get \"https://192.168.31.108:10250/stats/summary?only_cpu_and_memory=true\": x509: cannot validate certificate for 192.168.31.108 because it doesn't contain any IP SANs" node="node1"
......
因为部署集群的时候,CA 证书并没有把各个节点的 IP 签上去,所以这里 Metrics Server 通过 IP 去请求时,提示签的证书没有对应的 IP(错误:x509: cannot validate certificate for 192.168.31.108 because it doesn't contain any IP SANs),我们可以添加一个--kubelet-insecure-tls参数跳过证书校验:
args:
  - --cert-dir=/tmp
  - --secure-port=443
  - --kubelet-insecure-tls
  - --kubelet-preferred-address-types=InternalIP
然后再重新安装即可成功!可以通过如下命令来验证:
➜  ~ kubectl apply -f components.yaml
➜  ~ kubectl get pods -n kube-system -l k8s-app=metrics-server
NAME                              READY   STATUS    RESTARTS   AGE
metrics-server-85499dc4f5-mgpcb   1/1     Running   0          32s
➜  ~ kubectl logs -f metrics-server-85499dc4f5-mgpcb -n kube-system
I1115 10:14:19.401808       1 serving.go:341] Generated self-signed cert (/tmp/apiserver.crt, /tmp/apiserver.key)
I1115 10:14:19.840290       1 secure_serving.go:202] Serving securely on [::]:443
I1115 10:14:19.840395       1 requestheader_controller.go:169] Starting RequestHeaderAuthRequestController
I1115 10:14:19.840403       1 shared_informer.go:240] Waiting for caches to sync for RequestHeaderAuthRequestController
I1115 10:14:19.840411       1 dynamic_serving_content.go:130] Starting serving-cert::/tmp/apiserver.crt::/tmp/apiserver.key
I1115 10:14:19.840438       1 tlsconfig.go:240] Starting DynamicServingCertificateController
......
➜  ~ kubectl get apiservice | grep metrics
v1beta1.metrics.k8s.io                 kube-system/metrics-server   True        10m
➜  ~ kubectl get --raw "/apis/metrics.k8s.io/v1beta1/nodes"
{"kind":"NodeMetricsList","apiVersion":"metrics.k8s.io/v1beta1","metadata":{},"items":[{"metadata":{"name":"master1","creationTimestamp":"2021-11-15T10:15:38Z","labels":{"beta.kubernetes.io/arch":"amd64","beta.kubernetes.io/os":"linux","kubernetes.io/arch":"amd64","kubernetes.io/hostname":"master1","kubernetes.io/os":"linux","node-role.kubernetes.io/control-plane":"","node-role.kubernetes.io/master":"","node.kubernetes.io/exclude-from-external-load-balancers":""}},"timestamp":"2021-11-15T10:15:33Z","window":"20s","usage":{"cpu":"132348072n","memory":"813200Ki"}},{"metadata":{"name":"node1","creationTimestamp":"2021-11-15T10:15:38Z","labels":{"beta.kubernetes.io/arch":"amd64","beta.kubernetes.io/os":"linux","kubernetes.io/arch":"amd64","kubernetes.io/hostname":"node1","kubernetes.io/os":"linux"}},"timestamp":"2021-11-15T10:15:32Z","window":"20s","usage":{"cpu":"60153492n","memory":"520628Ki"}},{"metadata":{"name":"node2","creationTimestamp":"2021-11-15T10:15:38Z","labels":{"beta.kubernetes.io/arch":"amd64","beta.kubernetes.io/os":"linux","kubernetes.io/arch":"amd64","kubernetes.io/hostname":"node2","kubernetes.io/os":"linux"}},"timestamp":"2021-11-15T10:15:29Z","window":"20s","usage":{"cpu":"81697469n","memory":"557208Ki"}}]}
➜  ~ kubectl top nodes
NAME      CPU(cores)   CPU%   MEMORY(bytes)   MEMORY%
master1   115m         5%     794Mi           21%
node1     58m          1%     505Mi           6%
node2     55m          1%     545Mi           7%
现在我们可以通过 kubectl top 命令来获取到资源数据了,证明 Metrics Server 已经安装成功了。
HPA 对象
现在我们用 Deployment 来创建一个 Nginx Pod,然后利用 HPA 来进行自动扩缩容。资源清单如下所示:
# hpa-demo.yaml
apiVersion: apps/v1
kind: Deployment
metadata:
  name: hpa-demo
spec:
  selector:
    matchLabels:
      app: nginx
  template:
    metadata:
      labels:
        app: nginx
    spec:
      containers:
        - name: nginx
          image: nginx
          ports:
            - containerPort: 80
然后直接创建 Deployment,注意一定先把之前创建的具有 app=nginx 的 Pod 先清除掉:
➜  ~ kubectl apply -f hpa-demo.yaml
deployment.apps/hpa-demo created
➜  ~ kubectl get pods -l app=nginx
NAME                        READY   STATUS    RESTARTS   AGE
hpa-demo-7848d4b86f-khndb   1/1     Running   0          56s
现在我们来创建一个 HPA 资源对象,可以使用kubectl autoscale命令来创建:
➜  ~ kubectl autoscale deployment hpa-demo --cpu-percent=10 --min=1 --max=10
horizontalpodautoscaler.autoscaling/hpa-demo autoscaled
➜  ~ kubectl get hpa
NAME       REFERENCE             TARGETS         MINPODS   MAXPODS   REPLICAS   AGE
hpa-demo   Deployment/hpa-demo   <unknown>/10%   1         10        0          6s
此命令创建了一个关联资源 hpa-demo 的 HPA,最小的 Pod 副本数为 1,最大为 10。HPA 会根据设定的 cpu 使用率(10%)动态的增加或者减少 Pod 数量。
当然我们依然还是可以通过创建 YAML 文件的形式来创建 HPA 资源对象。如果我们不知道怎么编写的话,可以查看上面命令行创建的 HPA 的 YAML 文件:
➜  ~ kubectl get hpa hpa-demo -o yaml
apiVersion: autoscaling/v1
kind: HorizontalPodAutoscaler
metadata:
  annotations:
    autoscaling.alpha.kubernetes.io/conditions: '[{"type":"AbleToScale","status":"True","lastTransitionTime":"2021-11-15T10:19:06Z","reason":"SucceededGetScale","message":"the
      HPA controller was able to get the target''s current scale"},{"type":"ScalingActive","status":"False","lastTransitionTime":"2021-11-15T10:19:06Z","reason":"FailedGetResourceMetric","message":"the
      HPA was unable to compute the replica count: failed to get cpu utilization:
      missing request for cpu"}]'
  creationTimestamp: "2021-11-15T10:18:51Z"
  managedFields:
  - apiVersion: autoscaling/v1
    fieldsType: FieldsV1
    fieldsV1:
      f:spec:
        f:maxReplicas: {}
        f:minReplicas: {}
        f:scaleTargetRef: {}
        f:targetCPUUtilizationPercentage: {}
    manager: kubectl
    operation: Update
    time: "2021-11-15T10:18:51Z"
  - apiVersion: autoscaling/v1
    fieldsType: FieldsV1
    fieldsV1:
      f:metadata:
        f:annotations:
          .: {}
          f:autoscaling.alpha.kubernetes.io/conditions: {}
      f:status:
        f:currentReplicas: {}
    manager: kube-controller-manager
    operation: Update
    subresource: status
    time: "2021-11-15T10:19:06Z"
  name: hpa-demo
  namespace: default
  resourceVersion: "631809"
  uid: 34b91709-d003-4039-9cf0-05bb3fa4da73
spec:
  maxReplicas: 10
  minReplicas: 1
  scaleTargetRef:
    apiVersion: apps/v1
    kind: Deployment
    name: hpa-demo
  targetCPUUtilizationPercentage: 10
status:
  currentReplicas: 1
  desiredReplicas: 0
然后我们可以根据上面的 YAML 文件就可以自己来创建一个基于 YAML 的 HPA 描述文件了。但是我们发现上面信息里面出现了一些 Fail 信息,我们来查看下这个 HPA 对象的信息:
➜  ~ kubectl describe hpa hpa-demo
Name:                                                  hpa-demo
Namespace:                                             default
Labels:                                                <none>
Annotations:                                           <none>
CreationTimestamp:                                     Mon, 15 Nov 2021 18:18:51 +0800
Reference:                                             Deployment/hpa-demo
Metrics:                                               ( current / target )
  resource cpu on pods  (as a percentage of request):  <unknown> / 10%
Min replicas:                                          1
Max replicas:                                          10
Deployment pods:                                       1 current / 0 desired
Conditions:
  Type           Status  Reason                   Message
  ----           ------  ------                   -------
  AbleToScale    True    SucceededGetScale        the HPA controller was able to get the target's current scale
  ScalingActive  False   FailedGetResourceMetric  the HPA was unable to compute the replica count: failed to get cpu utilization: missing request for cpu
Events:
  Type     Reason                        Age               From                       Message
  ----     ------                        ----              ----                       -------
  Warning  FailedGetResourceMetric       1s (x3 over 31s)  horizontal-pod-autoscaler  failed to get cpu utilization: missing request for cpu
  Warning  FailedComputeMetricsReplicas  1s (x3 over 31s)  horizontal-pod-autoscaler  invalid metrics (1 invalid out of 1), first error is: failed to get cpu utilization: missing request for cpu
我们可以看到上面的事件信息里面出现了 failed to get cpu utilization: missing request for cpu 这样的错误信息。这是因为我们上面创建的 Pod 对象没有添加 request 资源声明,这样导致 HPA 读取不到 CPU 指标信息,所以如果要想让 HPA 生效,对应的 Pod 资源必须添加 requests 资源声明,更新我们的资源清单文件:
apiVersion: apps/v1
kind: Deployment
metadata:
  name: hpa-demo
spec:
  selector:
    matchLabels:
      app: nginx
  template:
    metadata:
      labels:
        app: nginx
    spec:
      containers:
        - name: nginx
          image: nginx
          ports:
            - containerPort: 80
          resources:
            requests:
              memory: 50Mi
              cpu: 50m
然后重新更新 Deployment,重新创建 HPA 对象:
➜  ~ kubectl apply -f hpa-demo.yaml
deployment.apps/hpa-demo configured
➜  ~ kubectl get pods -o wide -l app=nginx
NAME                        READY   STATUS    RESTARTS   AGE   IP            NODE    NOMINATED NODE   READINESS GATES
hpa-demo-6b4467b546-h489x   1/1     Running   0          18s   10.244.1.11   node1   <none>           <none>
➜  ~ kubectl delete hpa hpa-demo
horizontalpodautoscaler.autoscaling "hpa-demo" deleted
➜  ~ kubectl autoscale deployment hpa-demo --cpu-percent=10 --min=1 --max=10
horizontalpodautoscaler.autoscaling/hpa-demo autoscaled
➜  ~ kubectl describe hpa hpa-demo
Name:                                                  hpa-demo
Namespace:                                             default
Labels:                                                <none>
Annotations:                                           <none>
CreationTimestamp:                                     Mon, 15 Nov 2021 18:21:12 +0800
Reference:                                             Deployment/hpa-demo
Metrics:                                               ( current / target )
  resource cpu on pods  (as a percentage of request):  0% (0) / 10%
Min replicas:                                          1
Max replicas:                                          10
Deployment pods:                                       1 current / 1 desired
Conditions:
  Type            Status  Reason               Message
  ----            ------  ------               -------
  AbleToScale     True    ScaleDownStabilized  recent recommendations were higher than current one, applying the highest recent recommendation
  ScalingActive   True    ValidMetricFound     the HPA was able to successfully calculate a replica count from cpu resource utilization (percentage of request)
  ScalingLimited  False   DesiredWithinRange   the desired count is within the acceptable range
Events:           <none>
➜  ~ kubectl get hpa
NAME       REFERENCE             TARGETS   MINPODS   MAXPODS   REPLICAS   AGE
hpa-demo   Deployment/hpa-demo   0%/10%    1         10        1          35s
现在可以看到 HPA 资源对象已经正常了,现在我们来增大负载进行测试,我们来创建一个 busybox 的 Pod,并且循环访问上面创建的 Pod:
➜  ~ kubectl run -it --image busybox test-hpa --restart=Never --rm /bin/sh
If you don't see a command prompt, try pressing enter.
/ # while true; do wget -q -O- http://10.244.1.11; done
然后观察 Pod 列表,可以看到,HPA 已经开始工作:
➜  ~ kubectl get hpa
NAME       REFERENCE             TARGETS    MINPODS   MAXPODS   REPLICAS   AGE
hpa-demo   Deployment/hpa-demo   310%/10%   1         10        1          105s
➜  ~ kubectl get pods -l app=nginx --watch
NAME                        READY   STATUS              RESTARTS   AGE
hpa-demo-6b4467b546-h489x   1/1     Running             0          2m25s
hpa-demo-6b4467b546-pg4fz   0/1     ContainerCreating   0          9s
hpa-demo-6b4467b546-qrwv5   0/1     ContainerCreating   0          9s
hpa-demo-6b4467b546-s4vdz   0/1     ContainerCreating   0          9s
我们可以看到已经自动拉起了很多新的 Pod,最后会定格在了我们上面设置的 10 个 Pod,同时查看资源 hpa-demo 的副本数量,副本数量已经从原来的 1 变成了 10 个:
➜  ~ kubectl get deployment hpa-demo
NAME       READY   UP-TO-DATE   AVAILABLE   AGE
hpa-demo   10/10    10           10           2m56s
查看 HPA 资源的对象了解工作过程:
➜  ~ kubectl describe hpa hpa-demo
Name:                                                  hpa-demo
Namespace:                                             default
Labels:                                                <none>
Annotations:                                           <none>
CreationTimestamp:                                     Mon, 15 Nov 2021 18:21:12 +0800
Reference:                                             Deployment/hpa-demo
Metrics:                                               ( current / target )
  resource cpu on pods  (as a percentage of request):  110% (55m) / 10%
Min replicas:                                          1
Max replicas:                                          10
Deployment pods:                                       10 current / 10 desired
Conditions:
  Type            Status  Reason               Message
  ----            ------  ------               -------
  AbleToScale     True    ScaleDownStabilized  recent recommendations were higher than current one, applying the highest recent recommendation
  ScalingActive   True    ValidMetricFound     the HPA was able to successfully calculate a replica count from cpu resource utilization (percentage of request)
  ScalingLimited  True    TooManyReplicas      the desired replica count is more than the maximum replica count
Events:
  Type    Reason             Age   From                       Message
  ----    ------             ----  ----                       -------
  Normal  SuccessfulRescale  67s   horizontal-pod-autoscaler  New size: 4; reason: cpu resource utilization (percentage of request) above target
  Normal  SuccessfulRescale  52s   horizontal-pod-autoscaler  New size: 8; reason: cpu resource utilization (percentage of request) above target
  Normal  SuccessfulRescale  37s   horizontal-pod-autoscaler  New size: 10; reason: cpu resource utilization (percentage of request) above target
同样的这个时候我们来关掉 busybox 来减少负载,然后等待一段时间观察下 HPA 和 Deployment 对象:
➜  ~ k8strain3 kubectl get hpa
NAME       REFERENCE             TARGETS   MINPODS   MAXPODS   REPLICAS   AGE
hpa-demo   Deployment/hpa-demo   0%/10%    1         10        10         3m46s
➜  ~ kubectl get deployment hpa-demo
NAME       READY   UP-TO-DATE   AVAILABLE   AGE
hpa-demo   1/1     1            1           24m
!!! info "缩放间隙"
从 Kubernetes `v1.12` 版本开始我们可以通过设置 `kube-controller-manager` 组件的`--horizontal-pod-autoscaler-downscale-stabilization` 参数来设置一个持续时间,用于指定在当前操作完成后,`HPA` 必须等待多长时间才能执行另一次缩放操作。默认为5分钟,也就是默认需要等待5分钟后才会开始自动缩放。
可以看到副本数量已经由 10 变为 1,当前我们只是演示了 CPU 使用率这一个指标,在后面的课程中我们还会学习到根据自定义的监控指标来自动对 Pod 进行扩缩容。
内存
要使用基于内存或者自定义指标进行扩缩容(现在的版本都必须依赖 metrics-server 这个项目)。现在我们再用 Deployment 来创建一个 Nginx Pod,然后利用 HPA 来进行自动扩缩容。资源清单如下所示:
# hpa-mem-demo.yaml
apiVersion: apps/v1
kind: Deployment
metadata:
  name: hpa-mem-demo
spec:
  selector:
    matchLabels:
      app: nginx
  template:
    metadata:
      labels:
        app: nginx
    spec:
      volumes:
        - name: increase-mem-script
          configMap:
            name: increase-mem-config
      containers:
        - name: nginx
          image: nginx
          ports:
            - containerPort: 80
          volumeMounts:
            - name: increase-mem-script
              mountPath: /etc/script
          resources:
            requests:
              memory: 50Mi
              cpu: 50m
          securityContext:
            privileged: true
这里和前面普通的应用有一些区别,我们将一个名为 increase-mem-config 的 ConfigMap 资源对象挂载到了容器中,该配置文件是用于后面增加容器内存占用的脚本,配置文件如下所示:
# increase-mem-cm.yaml
apiVersion: v1
kind: ConfigMap
metadata:
  name: increase-mem-config
data:
  increase-mem.sh: |
    #!/bin/bash
    mkdir /tmp/memory
    mount -t tmpfs -o size=40M tmpfs /tmp/memory
    dd if=/dev/zero of=/tmp/memory/block
    sleep 60
    rm /tmp/memory/block
    umount /tmp/memory
    rmdir /tmp/memory
由于这里增加内存的脚本需要使用到 mount 命令,这需要声明为特权模式,所以我们添加了 securityContext.privileged=true 这个配置。现在我们直接创建上面的资源对象即可:
➜  ~ kubectl apply -f increase-mem-cm.yaml
➜  ~ kubectl apply -f hpa-mem-demo.yaml
➜  ~ kubectl get pods -l app=nginx
NAME                            READY   STATUS    RESTARTS   AGE
hpa-mem-demo-74675cc6c9-sqz2l   1/1     Running   0          17s
然后需要创建一个基于内存的 HPA 资源对象:
# hpa-mem.yaml
apiVersion: autoscaling/v2beta1
kind: HorizontalPodAutoscaler
metadata:
  name: hpa-mem-demo
  namespace: default
spec:
  maxReplicas: 5
  minReplicas: 1
  scaleTargetRef:
    apiVersion: apps/v1
    kind: Deployment
    name: hpa-mem-demo
  metrics: # 指定内存的一个配置
    - type: Resource
      resource:
        name: memory
        targetAverageUtilization: 30
要注意这里使用的 apiVersion 是 autoscaling/v2beta1,然后 metrics 属性里面指定的是内存的配置,直接创建上面的资源对象即可:
➜  ~ kubectl apply -f hpa-mem.yaml
horizontalpodautoscaler.autoscaling/hpa-mem-demo created
➜  ~ kubectl get hpa
NAME           REFERENCE                 TARGETS   MINPODS   MAXPODS   REPLICAS   AGE
hpa-mem-demo   Deployment/hpa-mem-demo   6%/30%    1         5         1          32s
到这里证明 HPA 资源对象已经部署成功了,接下来我们对应用进行压测,将内存压上去,直接执行上面我们挂载到容器中的 increase-mem.sh 脚本即可:
➜  ~ kubectl exec -it hpa-mem-demo-74675cc6c9-sqz2l -- /bin/bash
root@hpa-mem-demo-74675cc6c9-sqz2l:/# ls /etc/script/
increase-mem.sh
root@hpa-mem-demo-74675cc6c9-sqz2l:/# source /etc/script/increase-mem.sh
dd: writing to '/tmp/memory/block': No space left on device
81921+0 records in
81920+0 records out
41943040 bytes (42 MB, 40 MiB) copied, 0.0908717 s, 462 MB/s
然后打开另外一个终端观察 HPA 资源对象的变化情况:
➜  ~ kubectl get hpa -w
NAME           REFERENCE                 TARGETS   MINPODS   MAXPODS   REPLICAS   AGE
hpa-mem-demo   Deployment/hpa-mem-demo   87%/30%   1         5         3          90s
➜  ~ kubectl describe hpa hpa-mem-demo
Name:                                                     hpa-mem-demo
Namespace:                                                default
Labels:                                                   <none>
Annotations:                                              kubectl.kubernetes.io/last-applied-configuration:
                                                            {"apiVersion":"autoscaling/v2beta1","kind":"HorizontalPodAutoscaler","metadata":{"annotations":{},"name":"hpa-mem-demo","namespace":"defau...
CreationTimestamp:                                        Mon, 15 Nov 2021 18:40:37 +0800
Reference:                                                Deployment/hpa-mem-demo
Metrics:                                                  ( current / target )
  resource memory on pods  (as a percentage of request):  87% (45752320) / 30%
Min replicas:                                             1
Max replicas:                                             5
Deployment pods:                                          3 current / 3 desired
Conditions:
  Type            Status  Reason              Message
  ----            ------  ------              -------
  AbleToScale     True    ReadyForNewScale    recommended size matches current size
  ScalingActive   True    ValidMetricFound    the HPA was able to successfully calculate a replica count from memory resource utilization (percentage of request)
  ScalingLimited  False   DesiredWithinRange  the desired count is within the acceptable range
Events:
  Type     Reason                        Age   From                       Message
  ----     ------                        ----  ----                       -------
  Warning  FailedGetResourceMetric       87s   horizontal-pod-autoscaler  failed to get memory utilization: unable to get metrics for resource memory: no metrics returned from resource metrics API
  Warning  FailedComputeMetricsReplicas  87s   horizontal-pod-autoscaler  invalid metrics (1 invalid out of 1), first error is: failed to get memory utilization: unable to get metrics for resource memory: no metrics returned from resource metrics API
  Normal   SuccessfulRescale             27s   horizontal-pod-autoscaler  New size: 3; reason: memory resource utilization (percentage of request) above target
  Normal   SuccessfulRescale             46s    horizontal-pod-autoscaler  New size: 4; reason: memory resource utilization (percentage of request) above target
➜  ~ kubectl top pod hpa-mem-demo-74675cc6c9-gbj9t
NAME                            CPU(cores)   MEMORY(bytes)
hpa-mem-demo-66944b79bf-tqrn9   0m           41Mi
可以看到内存使用已经超过了我们设定的 30% 这个阈值了,HPA 资源对象也已经触发了自动扩容,变成了 4 个副本了:
➜  ~ kubectl get pods -l app=nginx
NAME                            READY   STATUS    RESTARTS   AGE
hpa-mem-demo-74675cc6c9-cpdw4   1/1     Running   0          69s
hpa-mem-demo-74675cc6c9-s8bz4   1/1     Running   0          114s
hpa-mem-demo-74675cc6c9-sqz2l   1/1     Running   0          3m9s
hpa-mem-demo-74675cc6c9-z8cx8   1/1     Running   0          114s
当内存释放掉后,controller-manager 默认 5 分钟过后会进行缩放,到这里就完成了基于内存的 HPA 操作。