Crane
Crane 是一个基于 FinOps 的云资源分析与成本优化平台,它的愿景是在保证客户应用运行质量的前提下实现极致的降本。Crane 已经在腾讯内部自研业务实现了大规模落地,部署数百个 Kubernetes 集群、管控 CPU 核数达百万,在降本增效方面取得了阶段性成果。以腾讯某部门集群优化为例,通过使用 FinOps Crane,该部门在保障业务稳定的情况下,资源利用率提升了 3 倍;腾讯另一自研业务落地 Crane 后,在一个月内实现了总 CPU 规模 40 万核的节省量,相当于成本节约超 1000 万元/月。
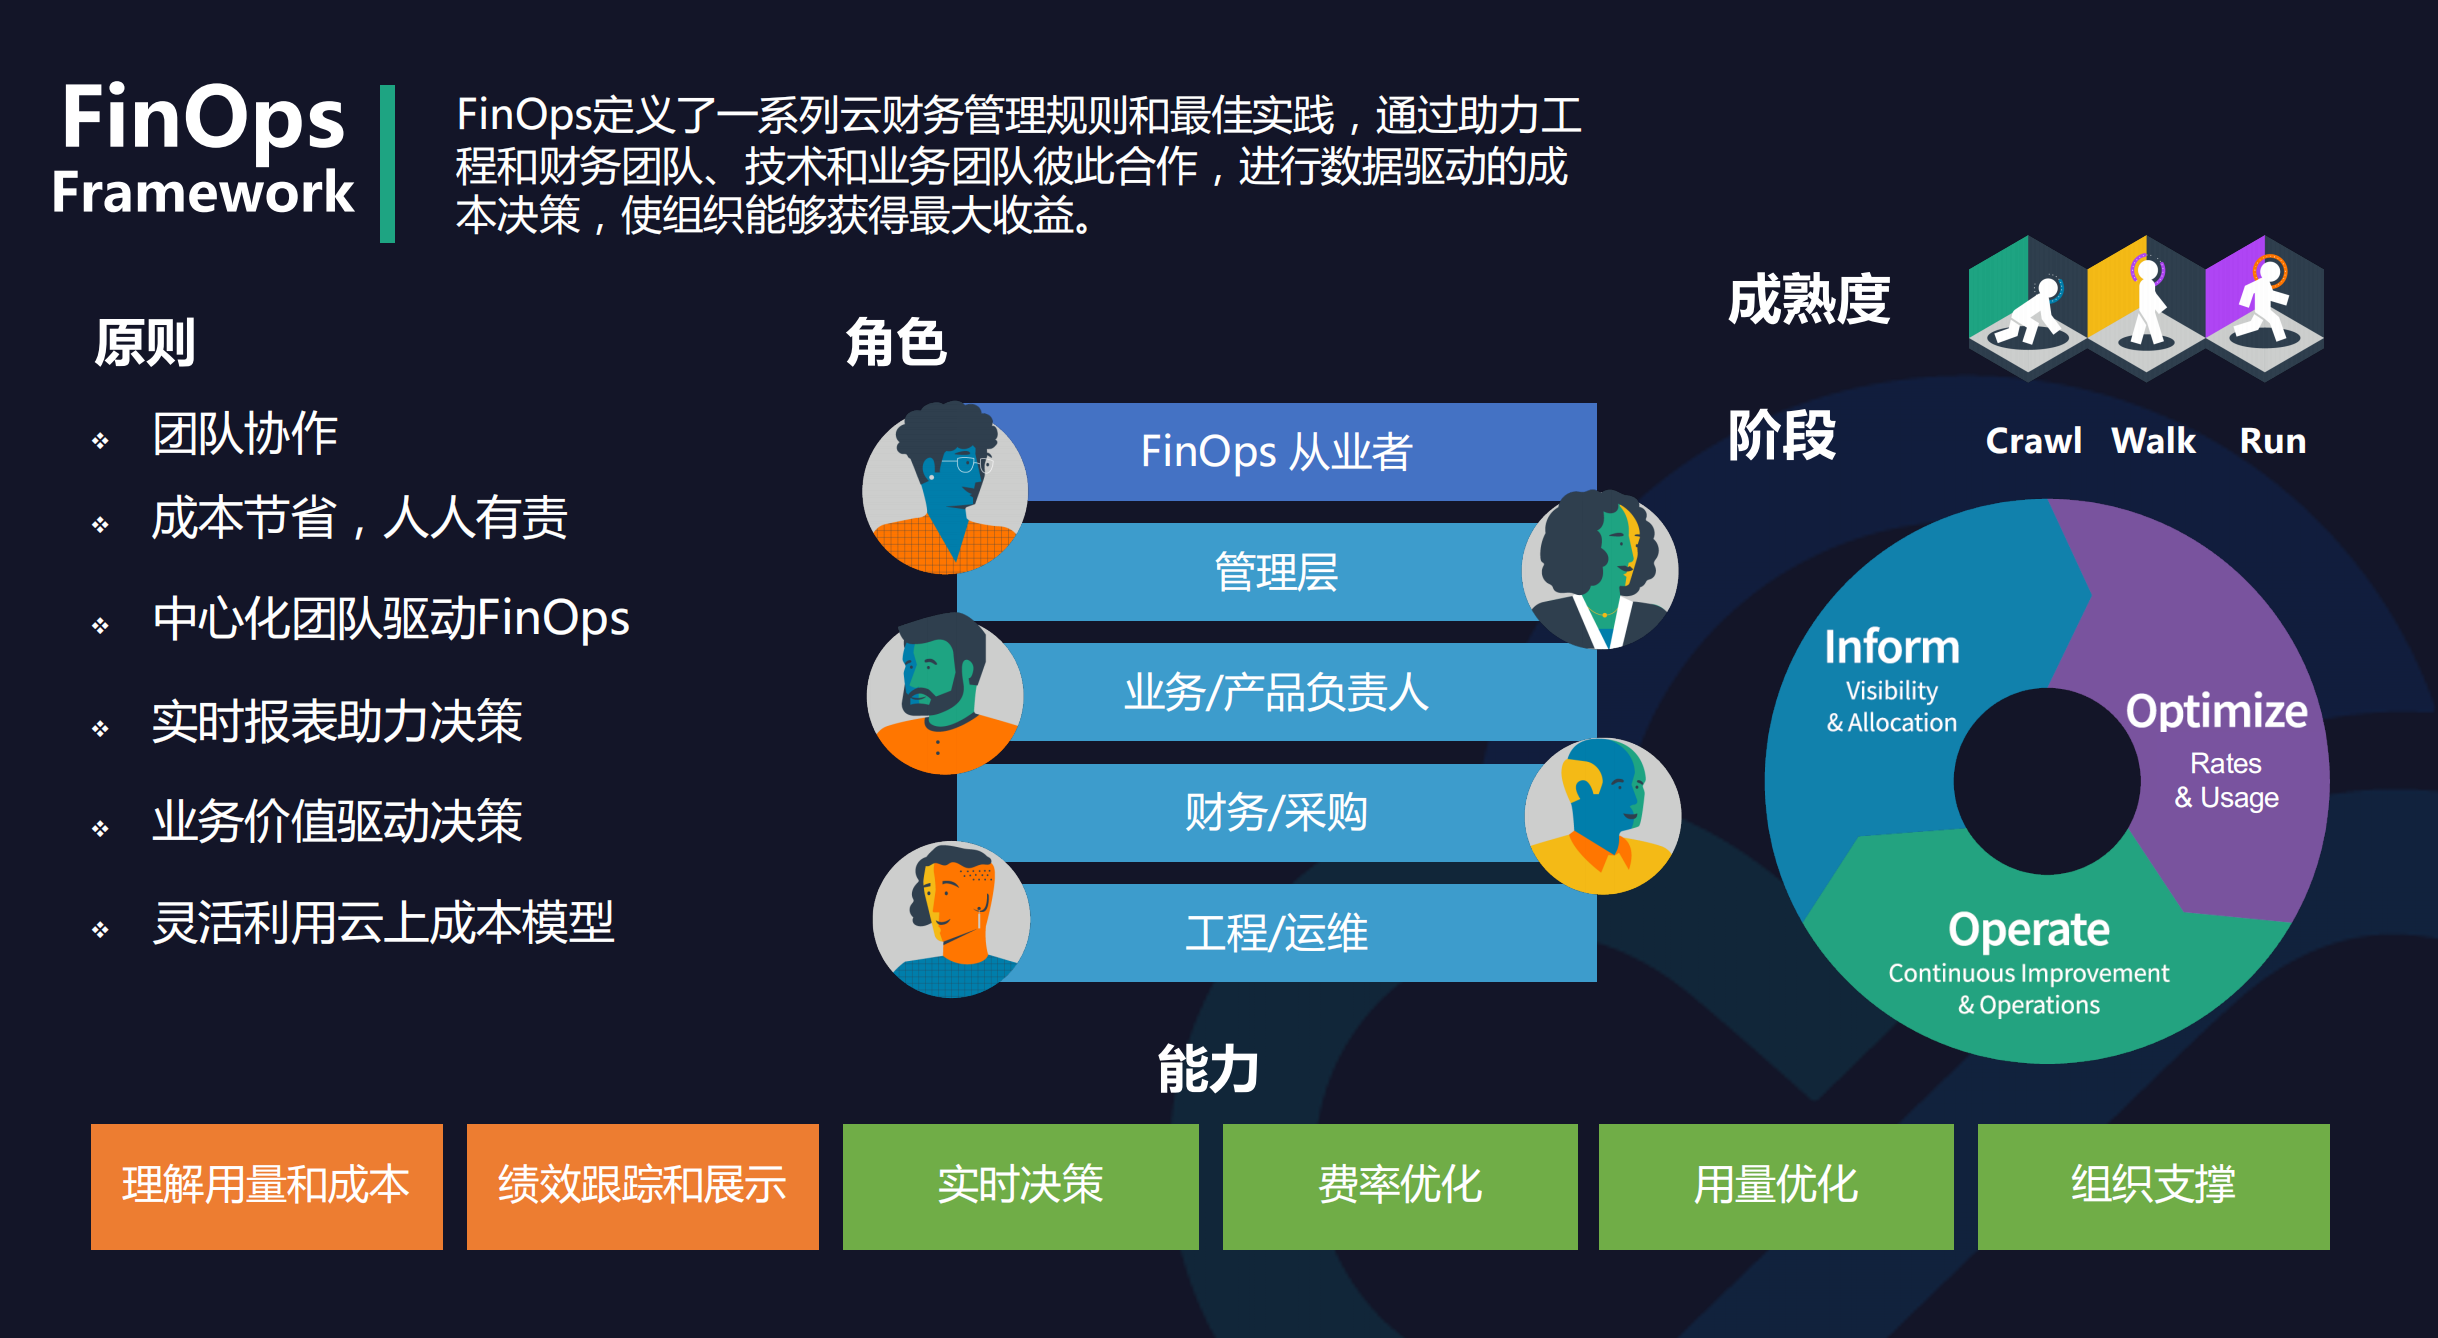
FinOps 是将 DevOps、财务和业务整合在一起的变革,其目标在于优化一个组织在云计算上的支出的财务规范和技术解决方案,即根据支出的历史记录和来自预期负载的信息,FinOps 可以在需要时预分配资源或估算成本。FinOps 可以称为“财务运维” ,或者更直白地称为“成本优化”,是将财务问责制引入云的 IT 支持,进行调整以优化质量和支出。
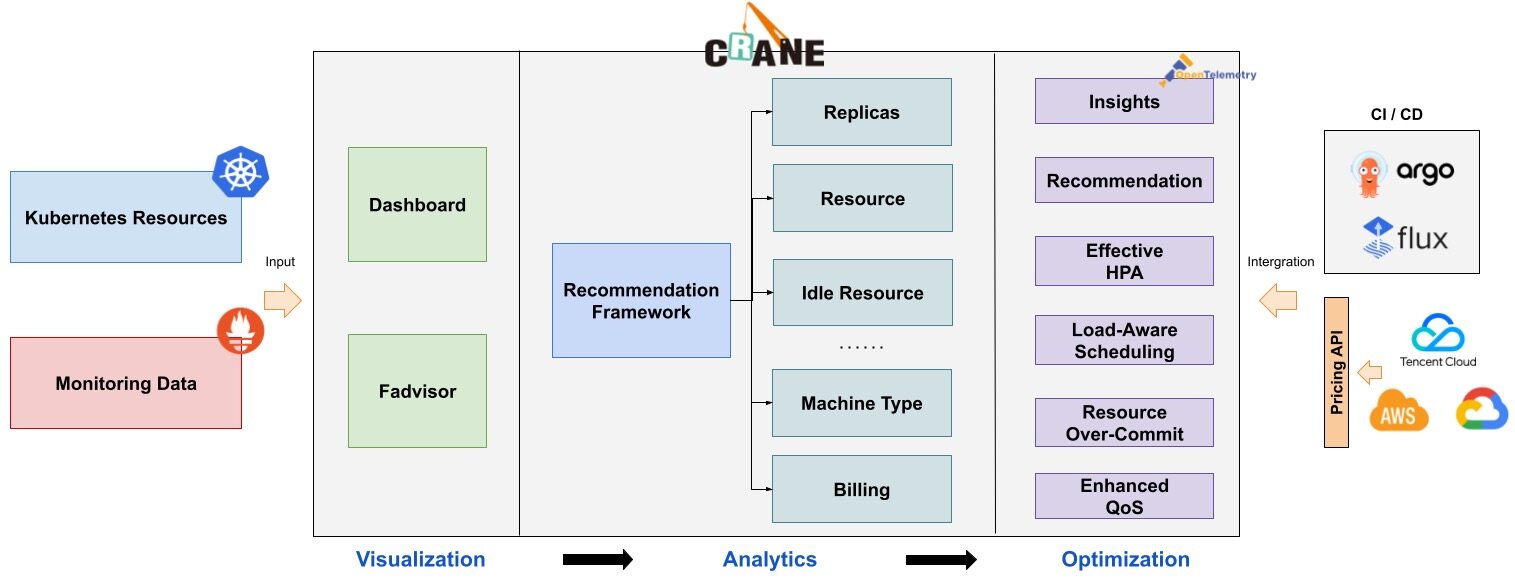
Crane 会通过下面 3 个方面来开启成本优化之旅:
- 成本展示: Kubernetes 资源( Deployments, StatefulSets )的多维度聚合与展示。
- 成本分析: 周期性的分析集群资源的状态并提供优化建议。
- 成本优化: 通过丰富的优化工具更新配置达成降本的目标。
成本可视化和优化评估
- 提供一组 Exporter 计算集群云资源的计费和账单数据并存储到你的监控系统,比如 Prometheus。
- 多维度的成本洞察,优化评估。通过 Cloud Provider 支持多云计费。
推荐框架
- 提供了一个可扩展的推荐框架以支持多种云资源的分析,内置了多种推荐器:
资源推荐、副本推荐、闲置资源推荐。
基于预测的水平弹性器
EffectiveHorizontalPodAutoscaler支持预测驱动的弹性。它基于社区 HPA 做底层的弹性控制,支持更丰富的弹性触发策略(预测、观测、周期),让弹性更加高效,并保障了服务的质量。
负载感知的调度器
- 动态调度器根据实际的节点利用率构建了一个简单但高效的模型,并过滤掉那些负载高的节点来平衡集群。
基于 QOS 的混部
QOS相关能力保证了运行在 Kubernetes 上的 Pod 的稳定性。具有多维指标条件下的干扰检测和主动回避能力,支持精确操作和自定义指标接入;具有预测算法增强的弹性资源超卖能力,复用和限制集群内的空闲资源;具备增强的旁路 cpuset 管理能力,在绑核的同时提升资源利用效率。
架构
Crane 的整体架构如下图所示:
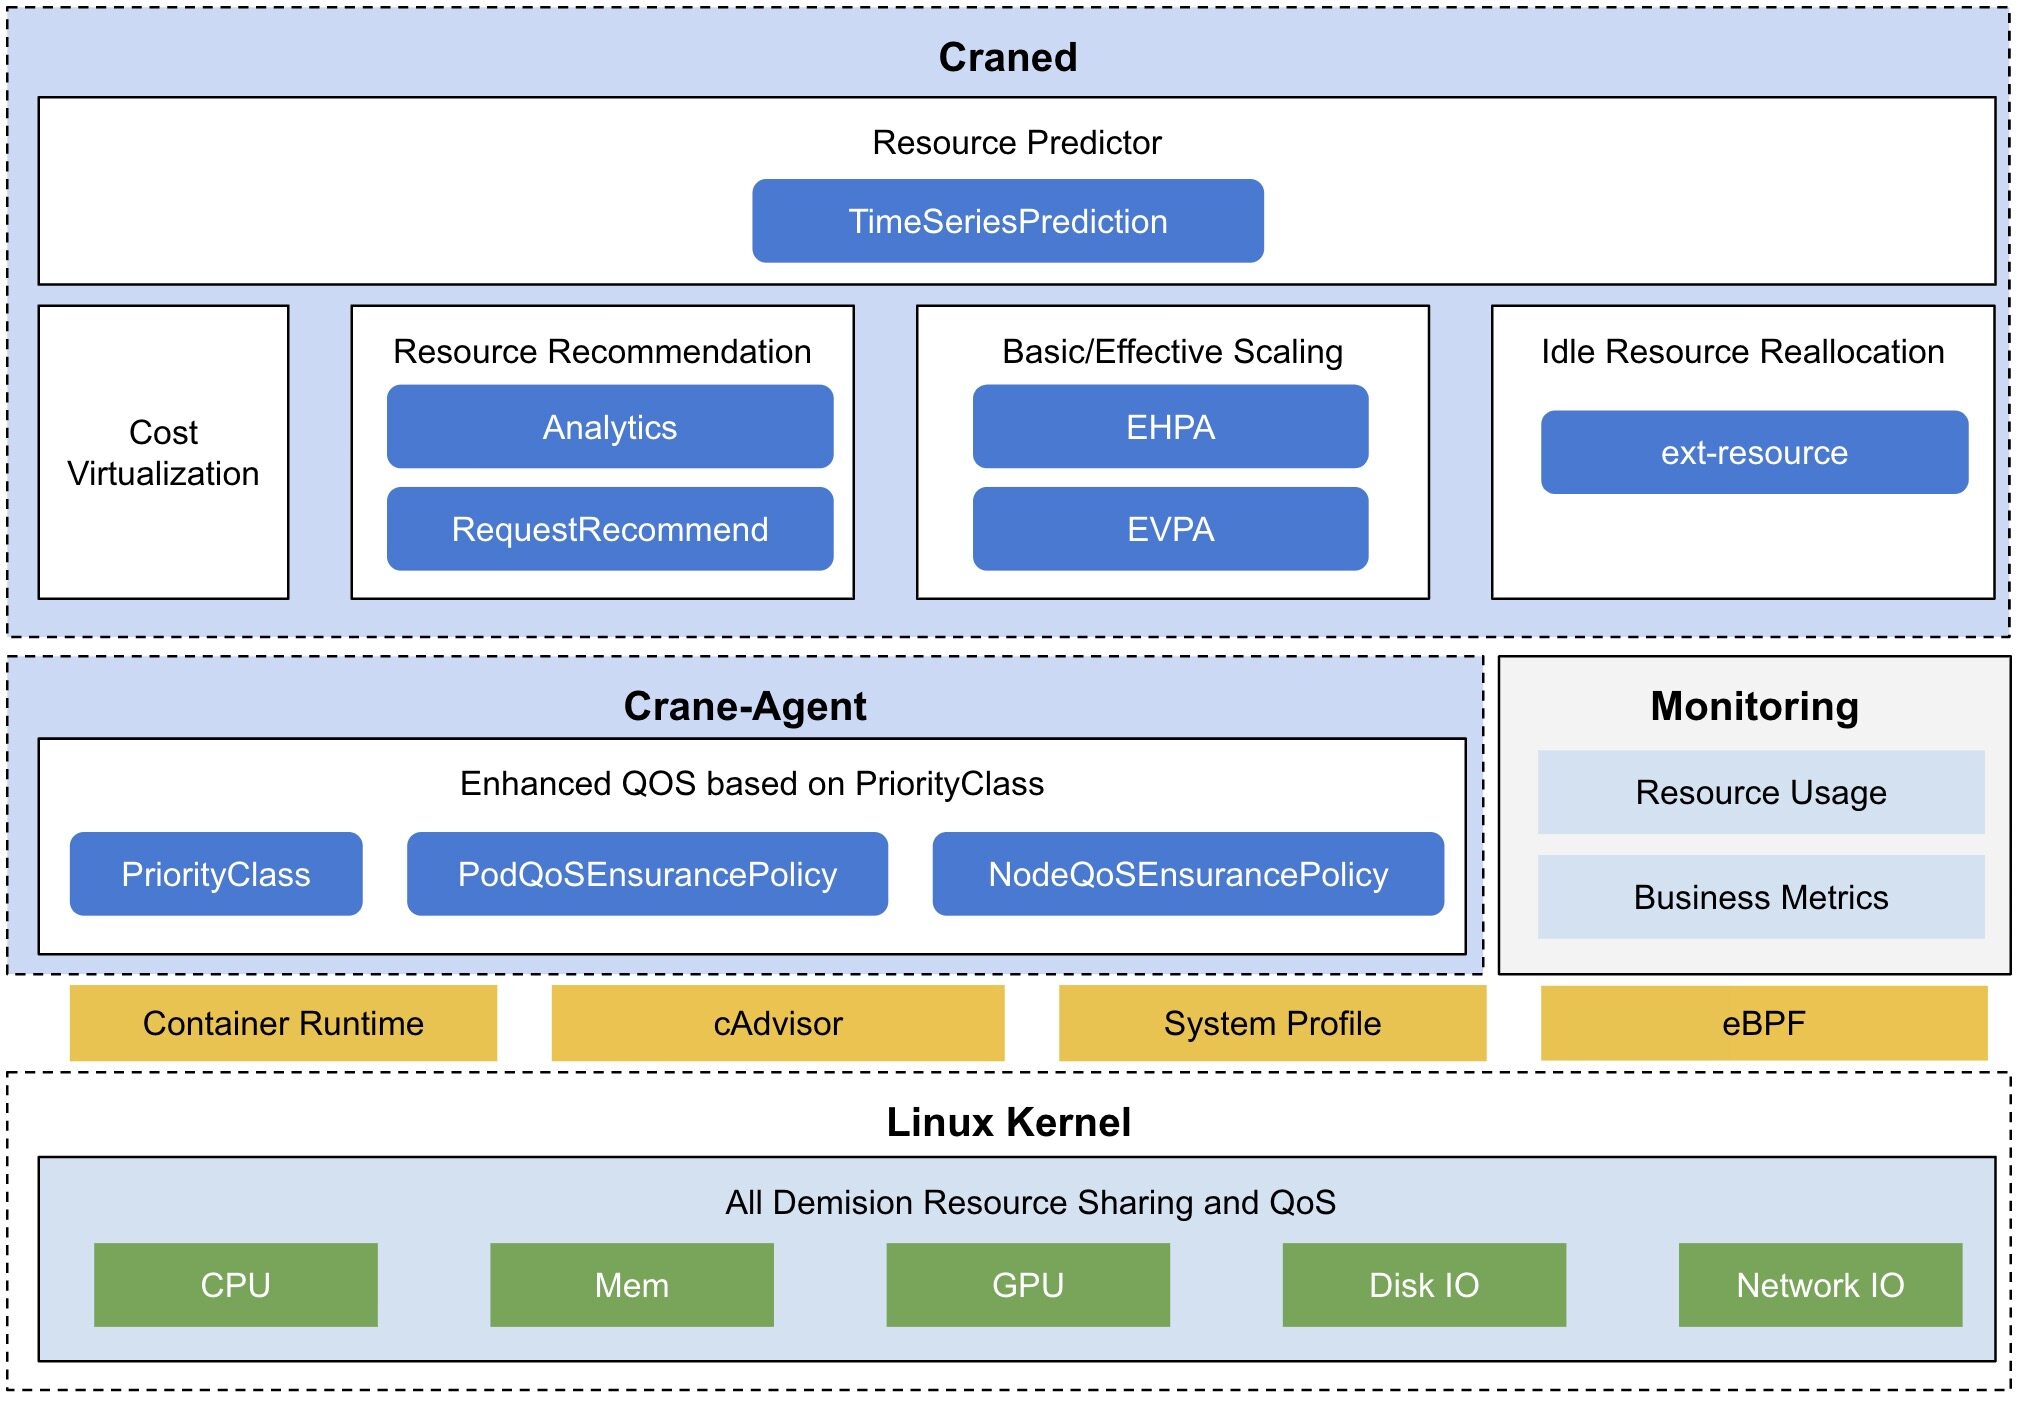
Craned:Craned 是 Crane 的最核心组件,它管理了 CRDs 的生命周期以及 API,Craned 通过 Deployment 方式部署且由两个容器组成:
- Craned: 运行了 Operators 用来管理 CRDs,向 Dashboard 提供 WebApi,Predictors 提供了 TimeSeries API
- Dashboard: 基于 TDesign's Starter 脚手架研发的前端项目,提供了易于上手的产品功能
Fadvisor:Fadvisor 提供一组 Exporter 计算集群云资源的计费和账单数据并存储到你的监控系统,比如 Prometheus。Fadvisor 通过 Cloud Provider 支持了多云计费的 API。
Metric Adapter:Metric Adapter 实现了一个 Custom Metric Apiserver,Metric Adapter 读取 CRDs 信息并提供基于 Custom/External Metric API 的 HPA Metric 的数据。
Crane Agent:Crane Agent 通过 DaemonSet 部署在集群的节点上。
安装
我们这里使用 Helm 的方式来进行安装,首先需要安装 Prometheus 和 Grafana(如果您已经在环境中部署了 Prometheus 和 Grafana,可以跳过该步骤)。
Crane 使用 Prometheus 获取集群工作负载对资源的使用情况,可以使用如下所示命令安装 Prometheus:
$ helm repo add prometheus-community https://finops-helm.pkg.coding.net/gocrane/prometheus-community
$ helm upgrade --install prometheus -n crane-system \
    --set pushgateway.enabled=false \
    --set alertmanager.enabled=false \
    --set server.persistentVolume.enabled=false \
    -f https://gitee.com/finops/helm-charts/raw/main/integration/prometheus/override_values.yaml \
    --create-namespace  prometheus-community/prometheus
由于 Crane 的 Fadvisor 会使用 Grafana 来展示成本预估,所以我们也需要安装 Grafana:
$ helm repo add grafana https://finops-helm.pkg.coding.net/gocrane/grafana
$ helm upgrade --install grafana \
    -f https://gitee.com/finops/helm-charts/raw/main/integration/grafana/override_values.yaml \
    -n crane-system \
    --create-namespace grafana/grafana
上面我们指定的 values 文件中配置了 Prometheus 数据源以及一些相关的 Dashboard,直接安装后即可使用。
然后接下来安装 crane 与 fadvisor,同样直接使用 Helm Chart 安装即可,如下命令所示:
$ helm repo add crane https://finops-helm.pkg.coding.net/gocrane/gocrane
$ helm upgrade --install crane -n crane-system --create-namespace crane/crane
$ helm upgrade --install fadvisor -n crane-system --create-namespace crane/fadvisor
安装后可以查看 Pod 列表了解应用状态:
$ kubectl get pods -n crane-system
NAME                                             READY   STATUS             RESTARTS         AGE
crane-agent-8jrs5                                0/1     CrashLoopBackOff   71 (2m26s ago)   3h23m
crane-agent-t2rpz                                0/1     CrashLoopBackOff   71 (65s ago)     3h23m
craned-776c7b6c75-gx8cp                          2/2     Running            0                3h28m
fadvisor-56fcc547b6-zvf6r                        1/1     Running            0                158m
grafana-5cd57f9f6b-d7nk5                         1/1     Running            0                3h32m
metric-adapter-887f6548d-qcbb8                   1/1     Running            0                3h28m
prometheus-kube-state-metrics-5f6f856ffb-4lrrr   1/1     Running            0                3h34m
prometheus-node-exporter-97vmz                   1/1     Running            0                3h27m
prometheus-node-exporter-m2gr9                   1/1     Running            0                3h27m
prometheus-server-7744f66fb4-lw2sz               2/2     Running            0                3h34m
需要注意我们这里 crane-agent 启动失败了,这是因为我的 K8s 集群使用的是 containerd 这种容器运行时,需要明确声明指定使用的运行时 endpoint:
$ kubectl edit ds crane-agent -n crane-system
# ......
    spec:
      containers:
      - args:
        - --v=2
        - --runtime-endpoint=/run/containerd/containerd.sock  # 指定有containerd的sock文件
        command:
        - /crane-agent
# ......
此外还需要更新 crane-agent 的 rbac 权限:
$ kubectl edit clusterrole crane-agent
# ......
- apiGroups:
  - ensurance.crane.io
  resources:
  - podqosensurancepolicies
  - nodeqoss  # 增加 nodeqoss 和 podqoss 资源的权限
  - podqoss
# ......
然后我们可以再创建一个 Ingress 对象来暴露 crane 的 dashboard 服务:
apiVersion: networking.k8s.io/v1
kind: Ingress
metadata:
  name: ingress-crane-dashboard
  namespace: crane-system
spec:
  ingressClassName: nginx
  rules:
    - host: crane.k8s.local # change to your domain
      http:
        paths:
          - path: /
            pathType: Prefix
            backend:
              service:
                name: craned
                port:
                  number: 9090
直接应用该 ingress 资源对象即可,当然前提是你已经安装了 ingress-nginx:
$ kubectl get pods -n ingress-nginx
NAME                                            READY   STATUS    RESTARTS      AGE
ingress-nginx-controller-7647c44fb9-6gcsf       1/1     Running   8 (44m ago)   21d
ingress-nginx-defaultbackend-7fc5bfd66c-gqmmj   1/1     Running   8 (44m ago)   21d
$ kubectl get ingress -n crane-system
NAME                      CLASS   HOSTS             ADDRESS        PORTS   AGE
ingress-crane-dashboard   nginx   crane.k8s.local   192.168.0.52   80      11s
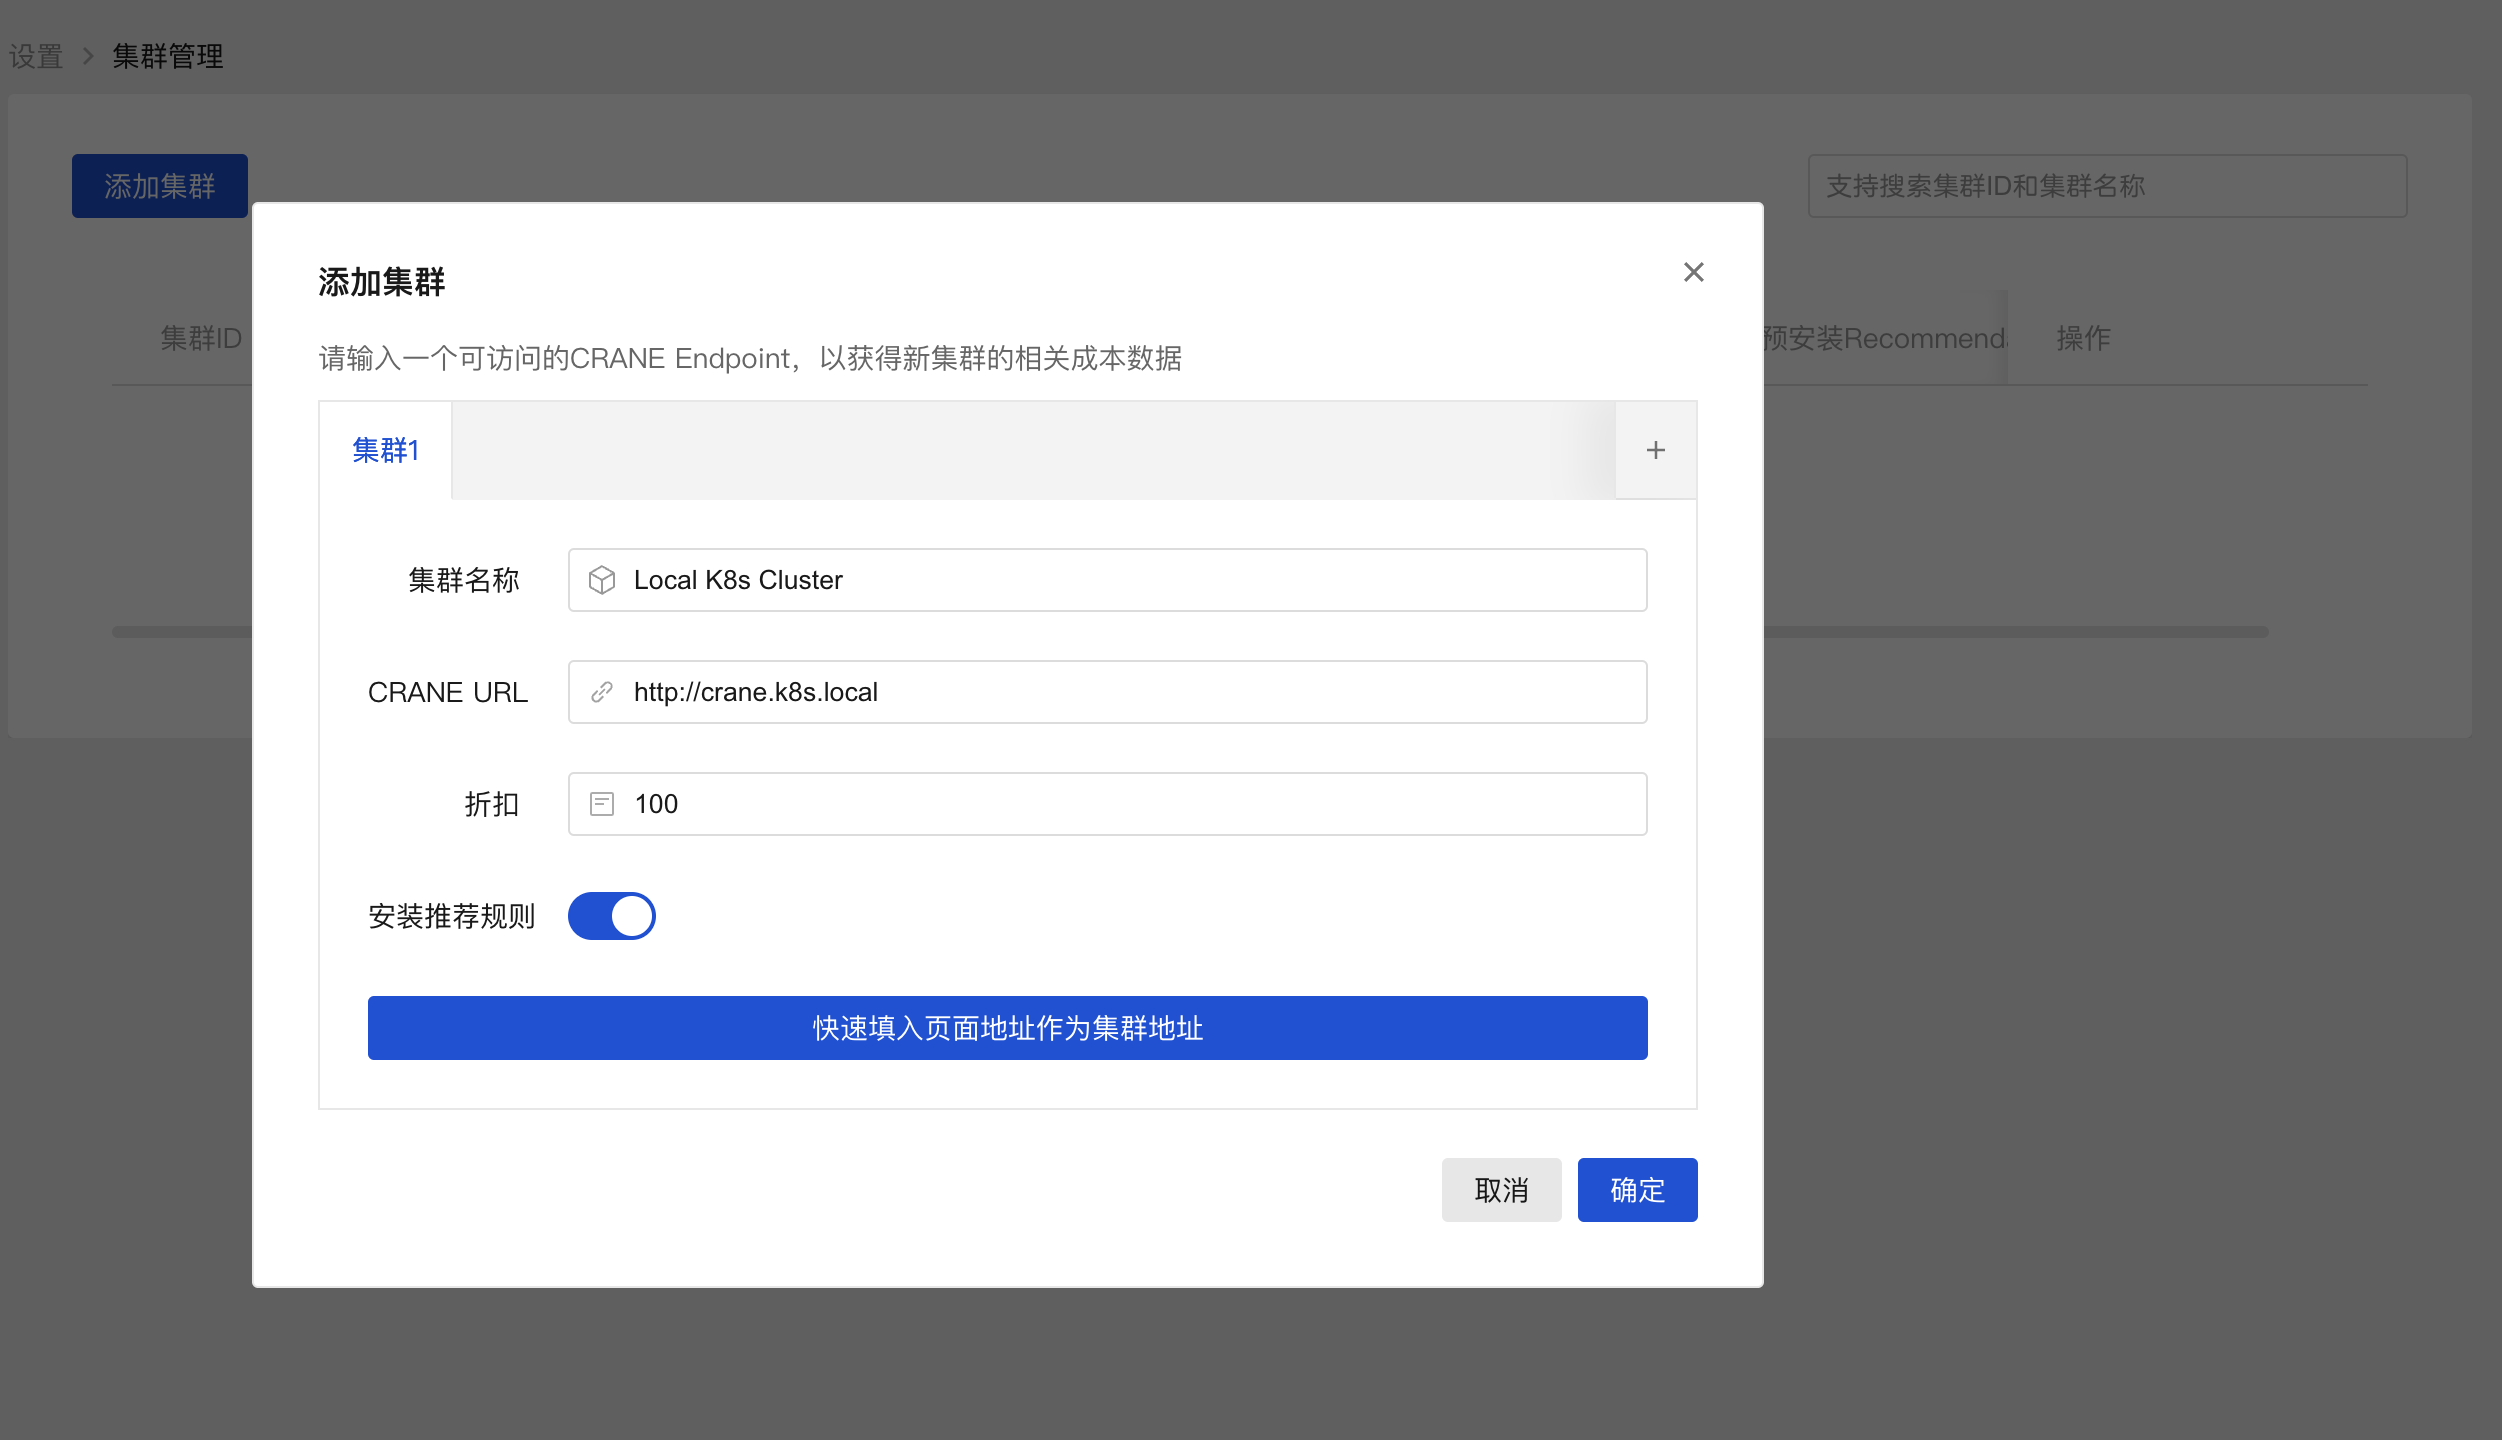
将 crane.k8s.local 映射到 192.168.0.52 后就可以访问 crane 的 dashboard 了:
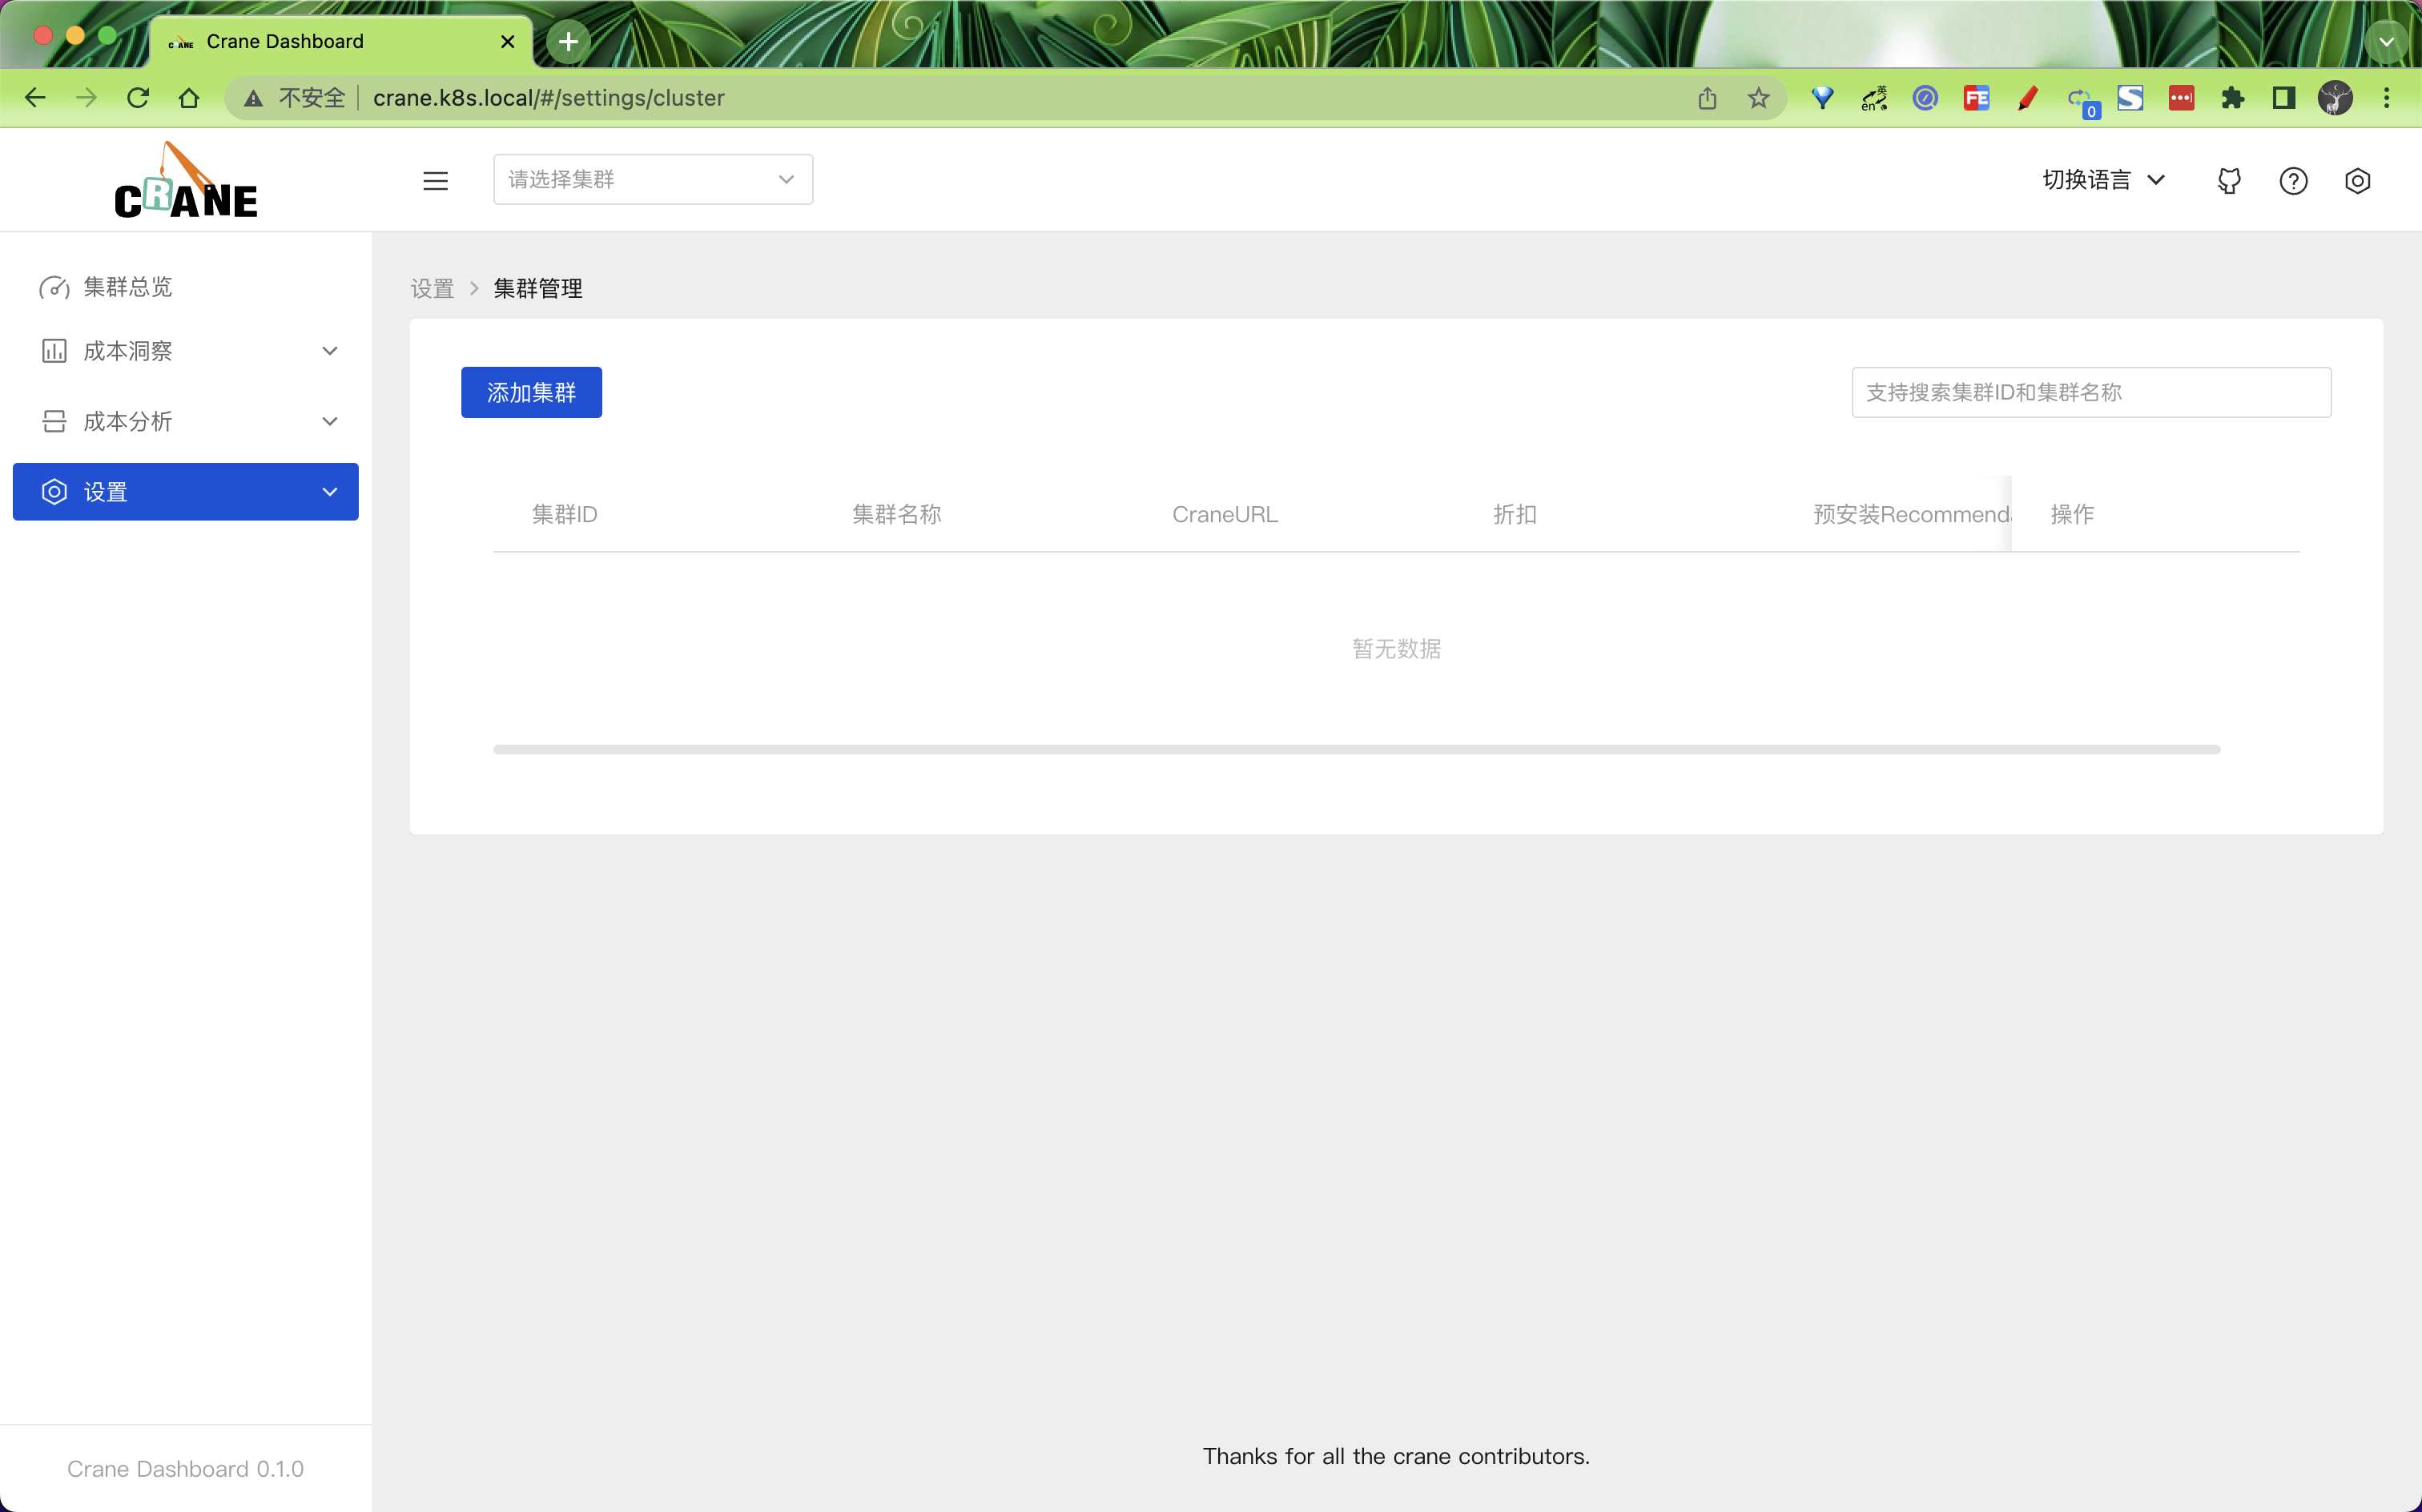
第一次访问 dashboard 的时候需要添加一个 K8s 集群,添加添加集群按钮开始添加,填入正确的 CRNE Endpoint 地址即可。
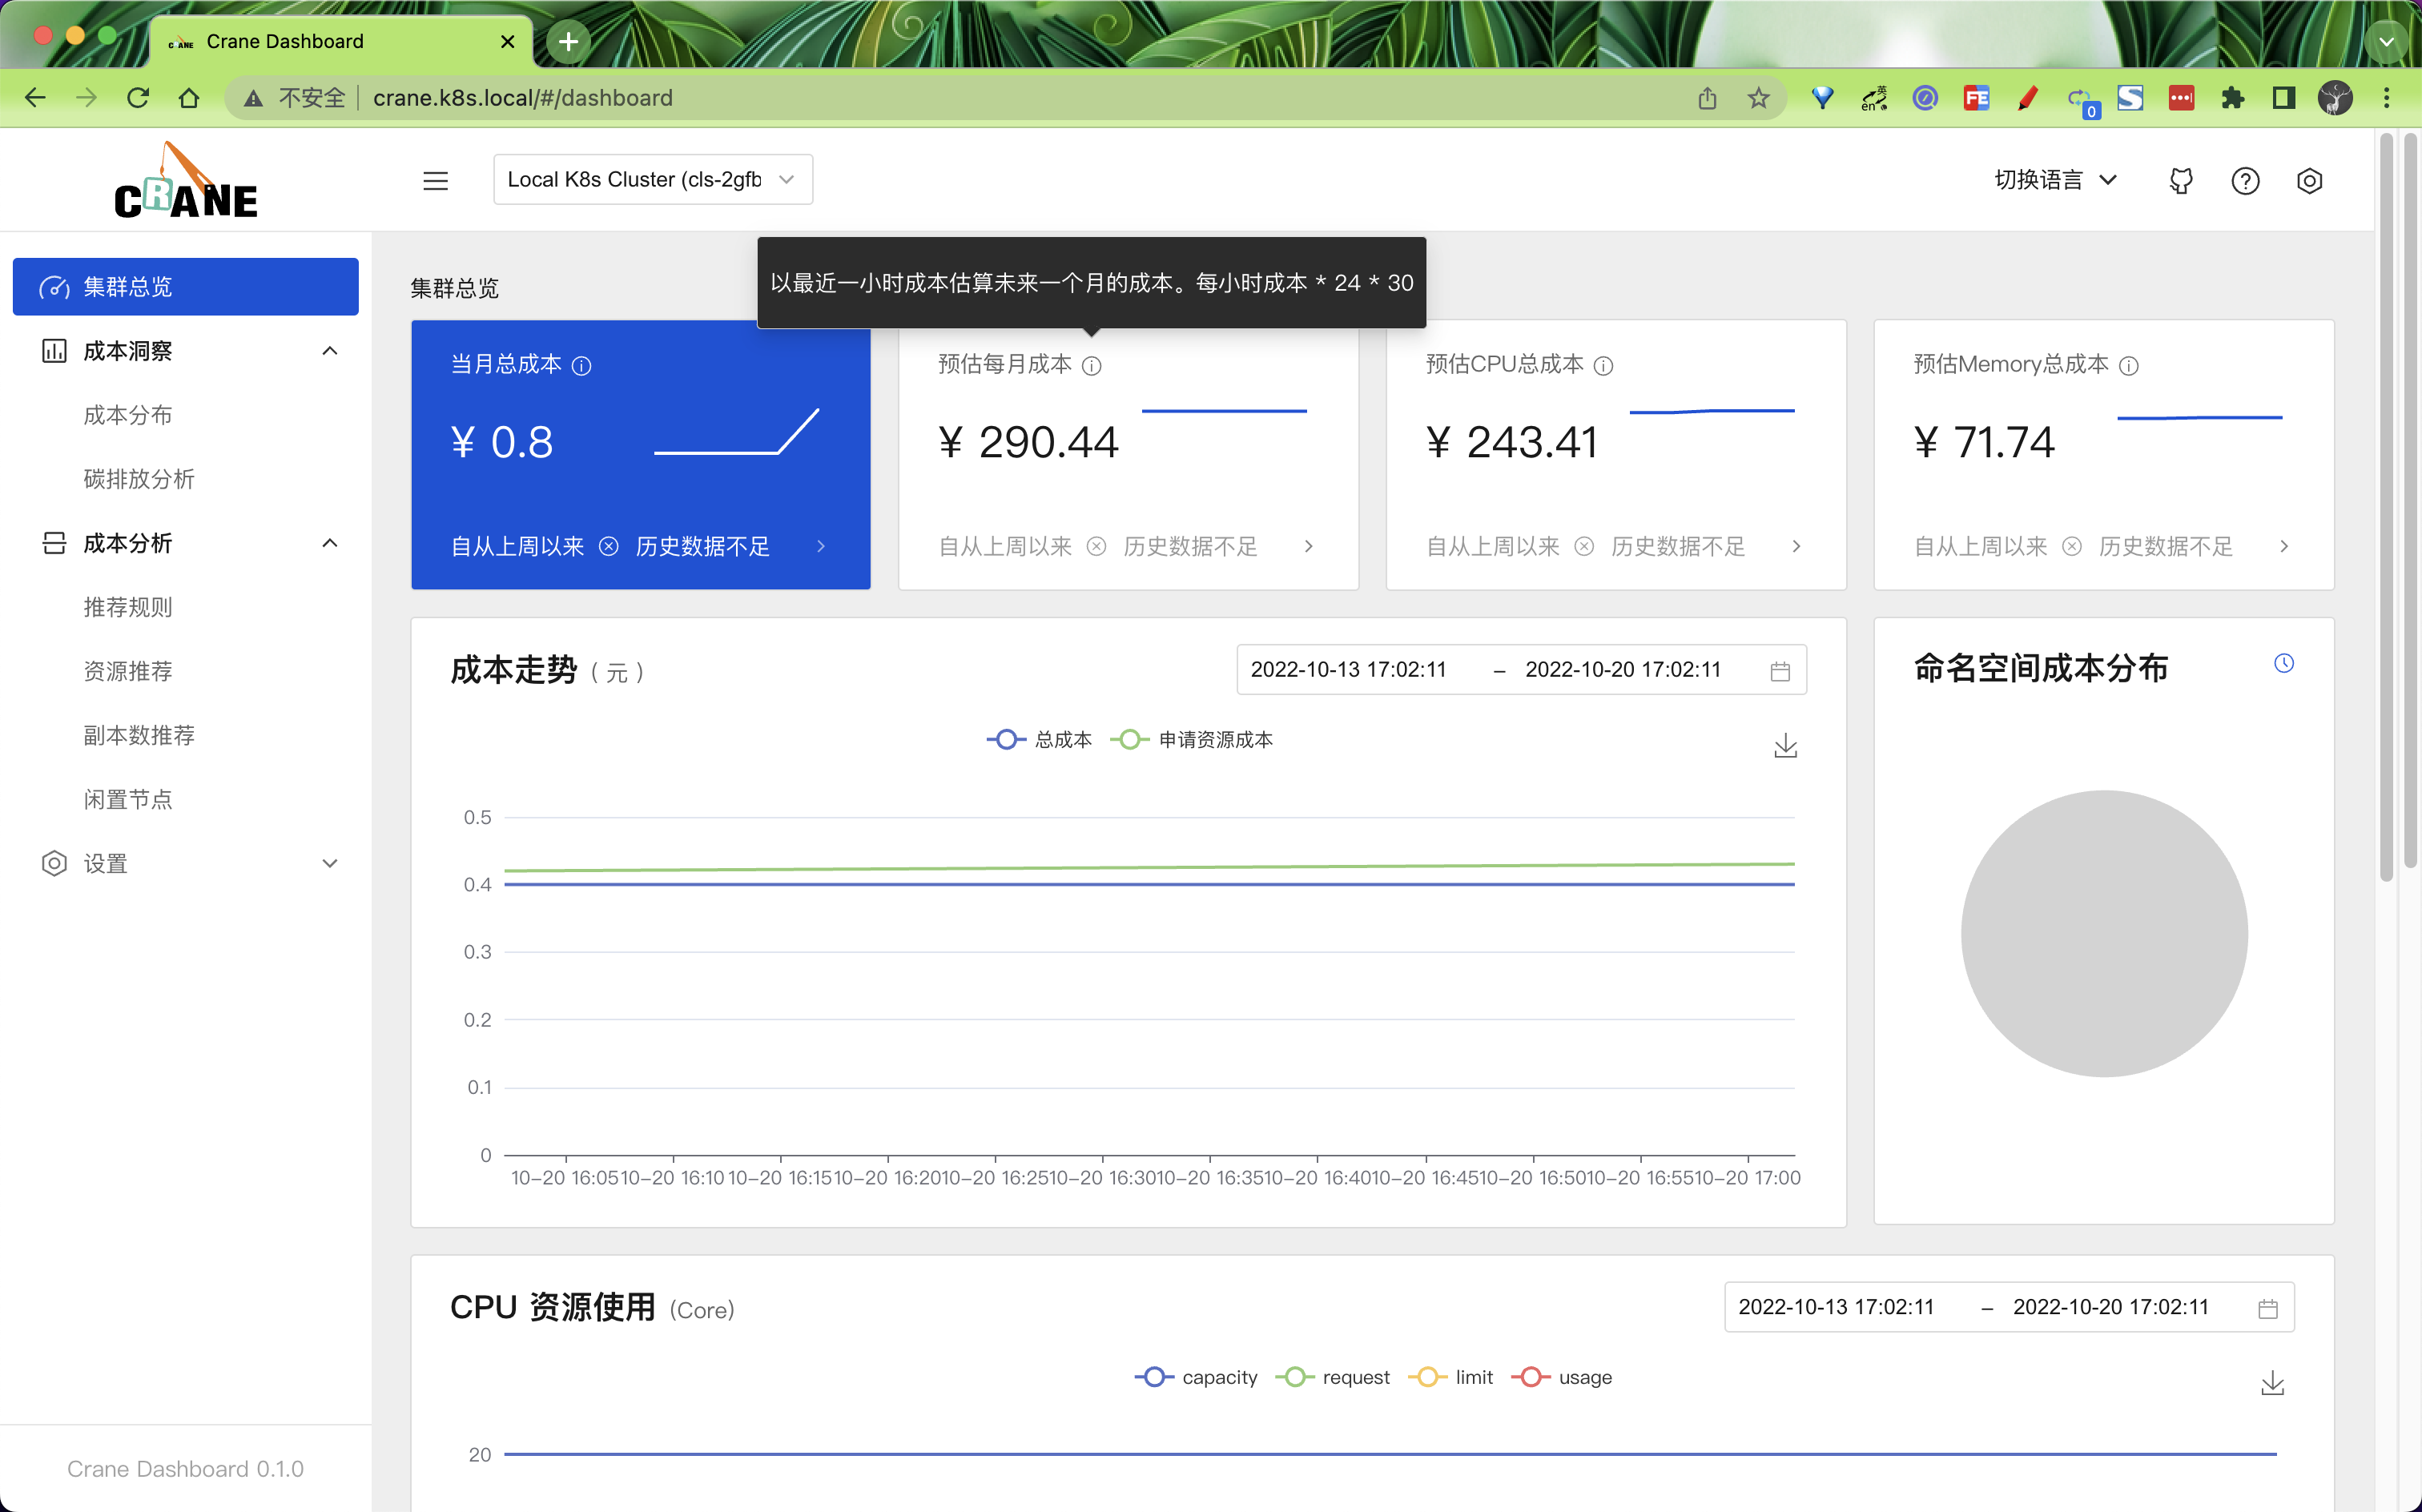
然后切换到集群总览可以查看到当前集群的一些成本相关数据,由于目前数据还不足,所以会有一些空的图表。
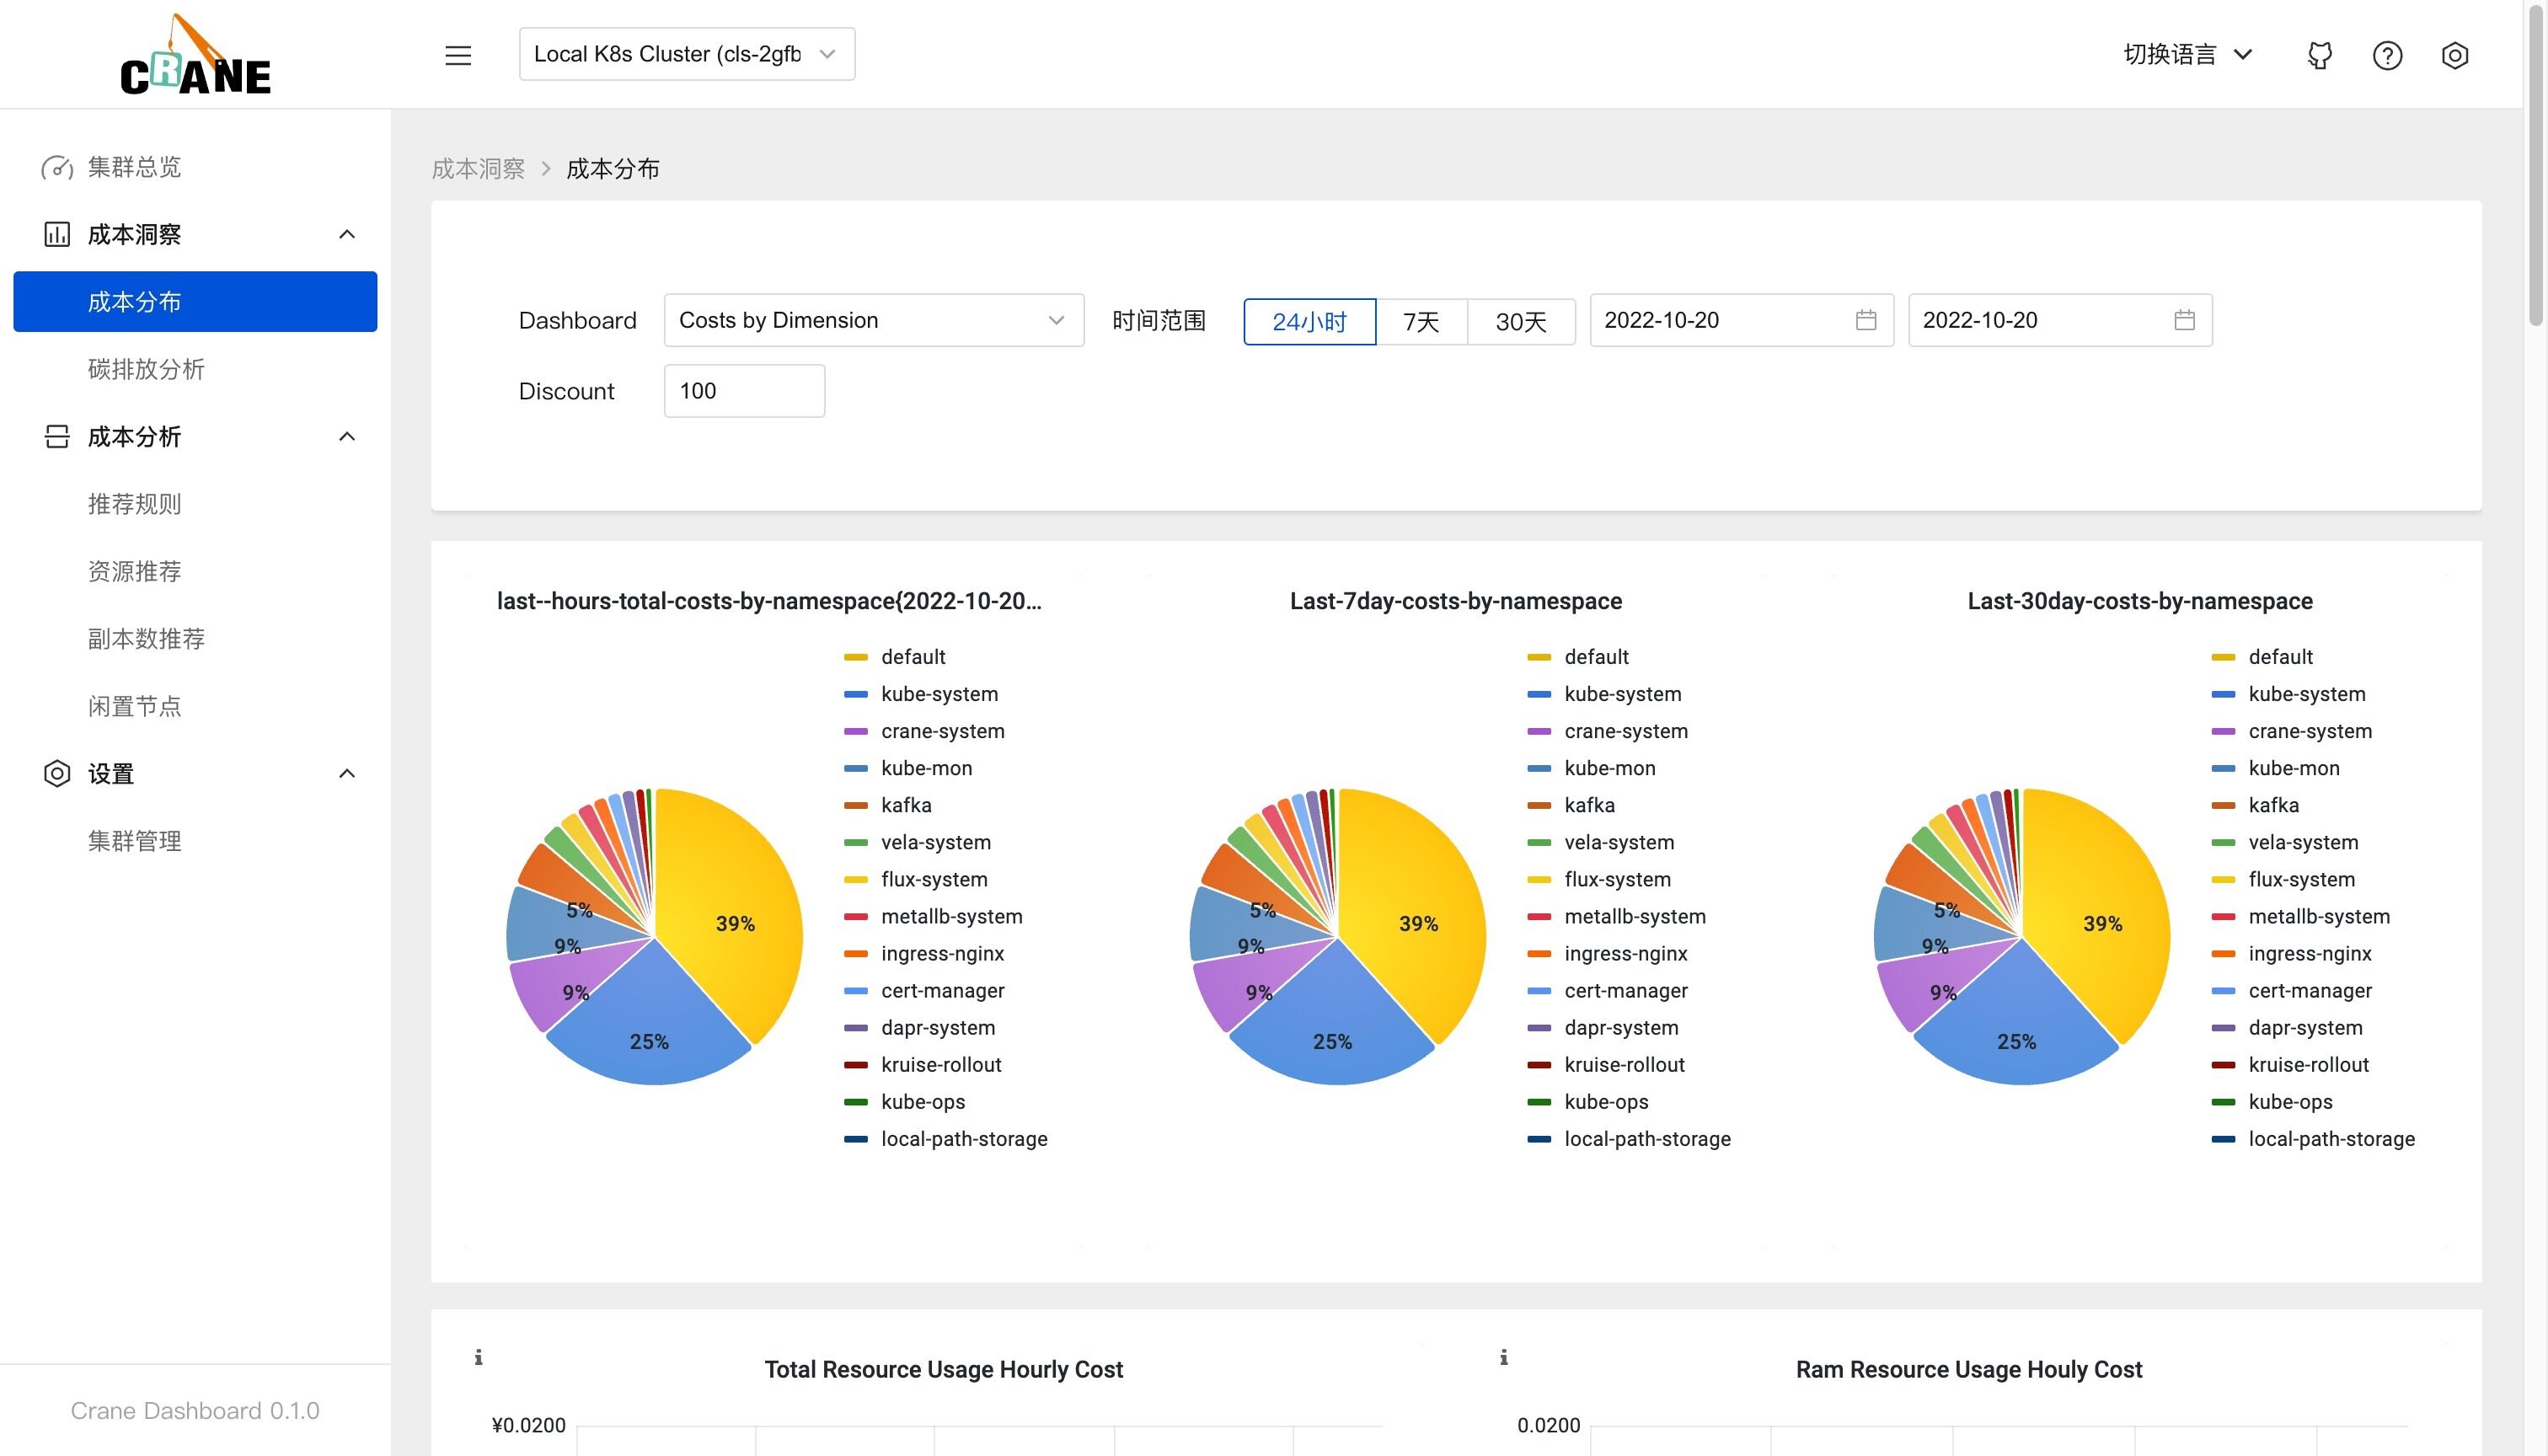
在成本分布页面可以按照维度成本、集群成本和利用率指标以及命名空间成本来展示成本的分布情况。
智能推荐
在 dasbhoard 中开箱后就可以看到相关的成本数据,是因为在添加集群的时候我们安装了推荐的规则。
推荐框架会自动分析集群的各种资源的运行情况并给出优化建议。Crane 的推荐模块会定期检测发现集群资源配置的问题,并给出优化建议。智能推荐提供了多种 Recommender 来实现面向不同资源的优化推荐。
在成本分析>推荐规则页面可以看到我们安装的两个推荐规则。
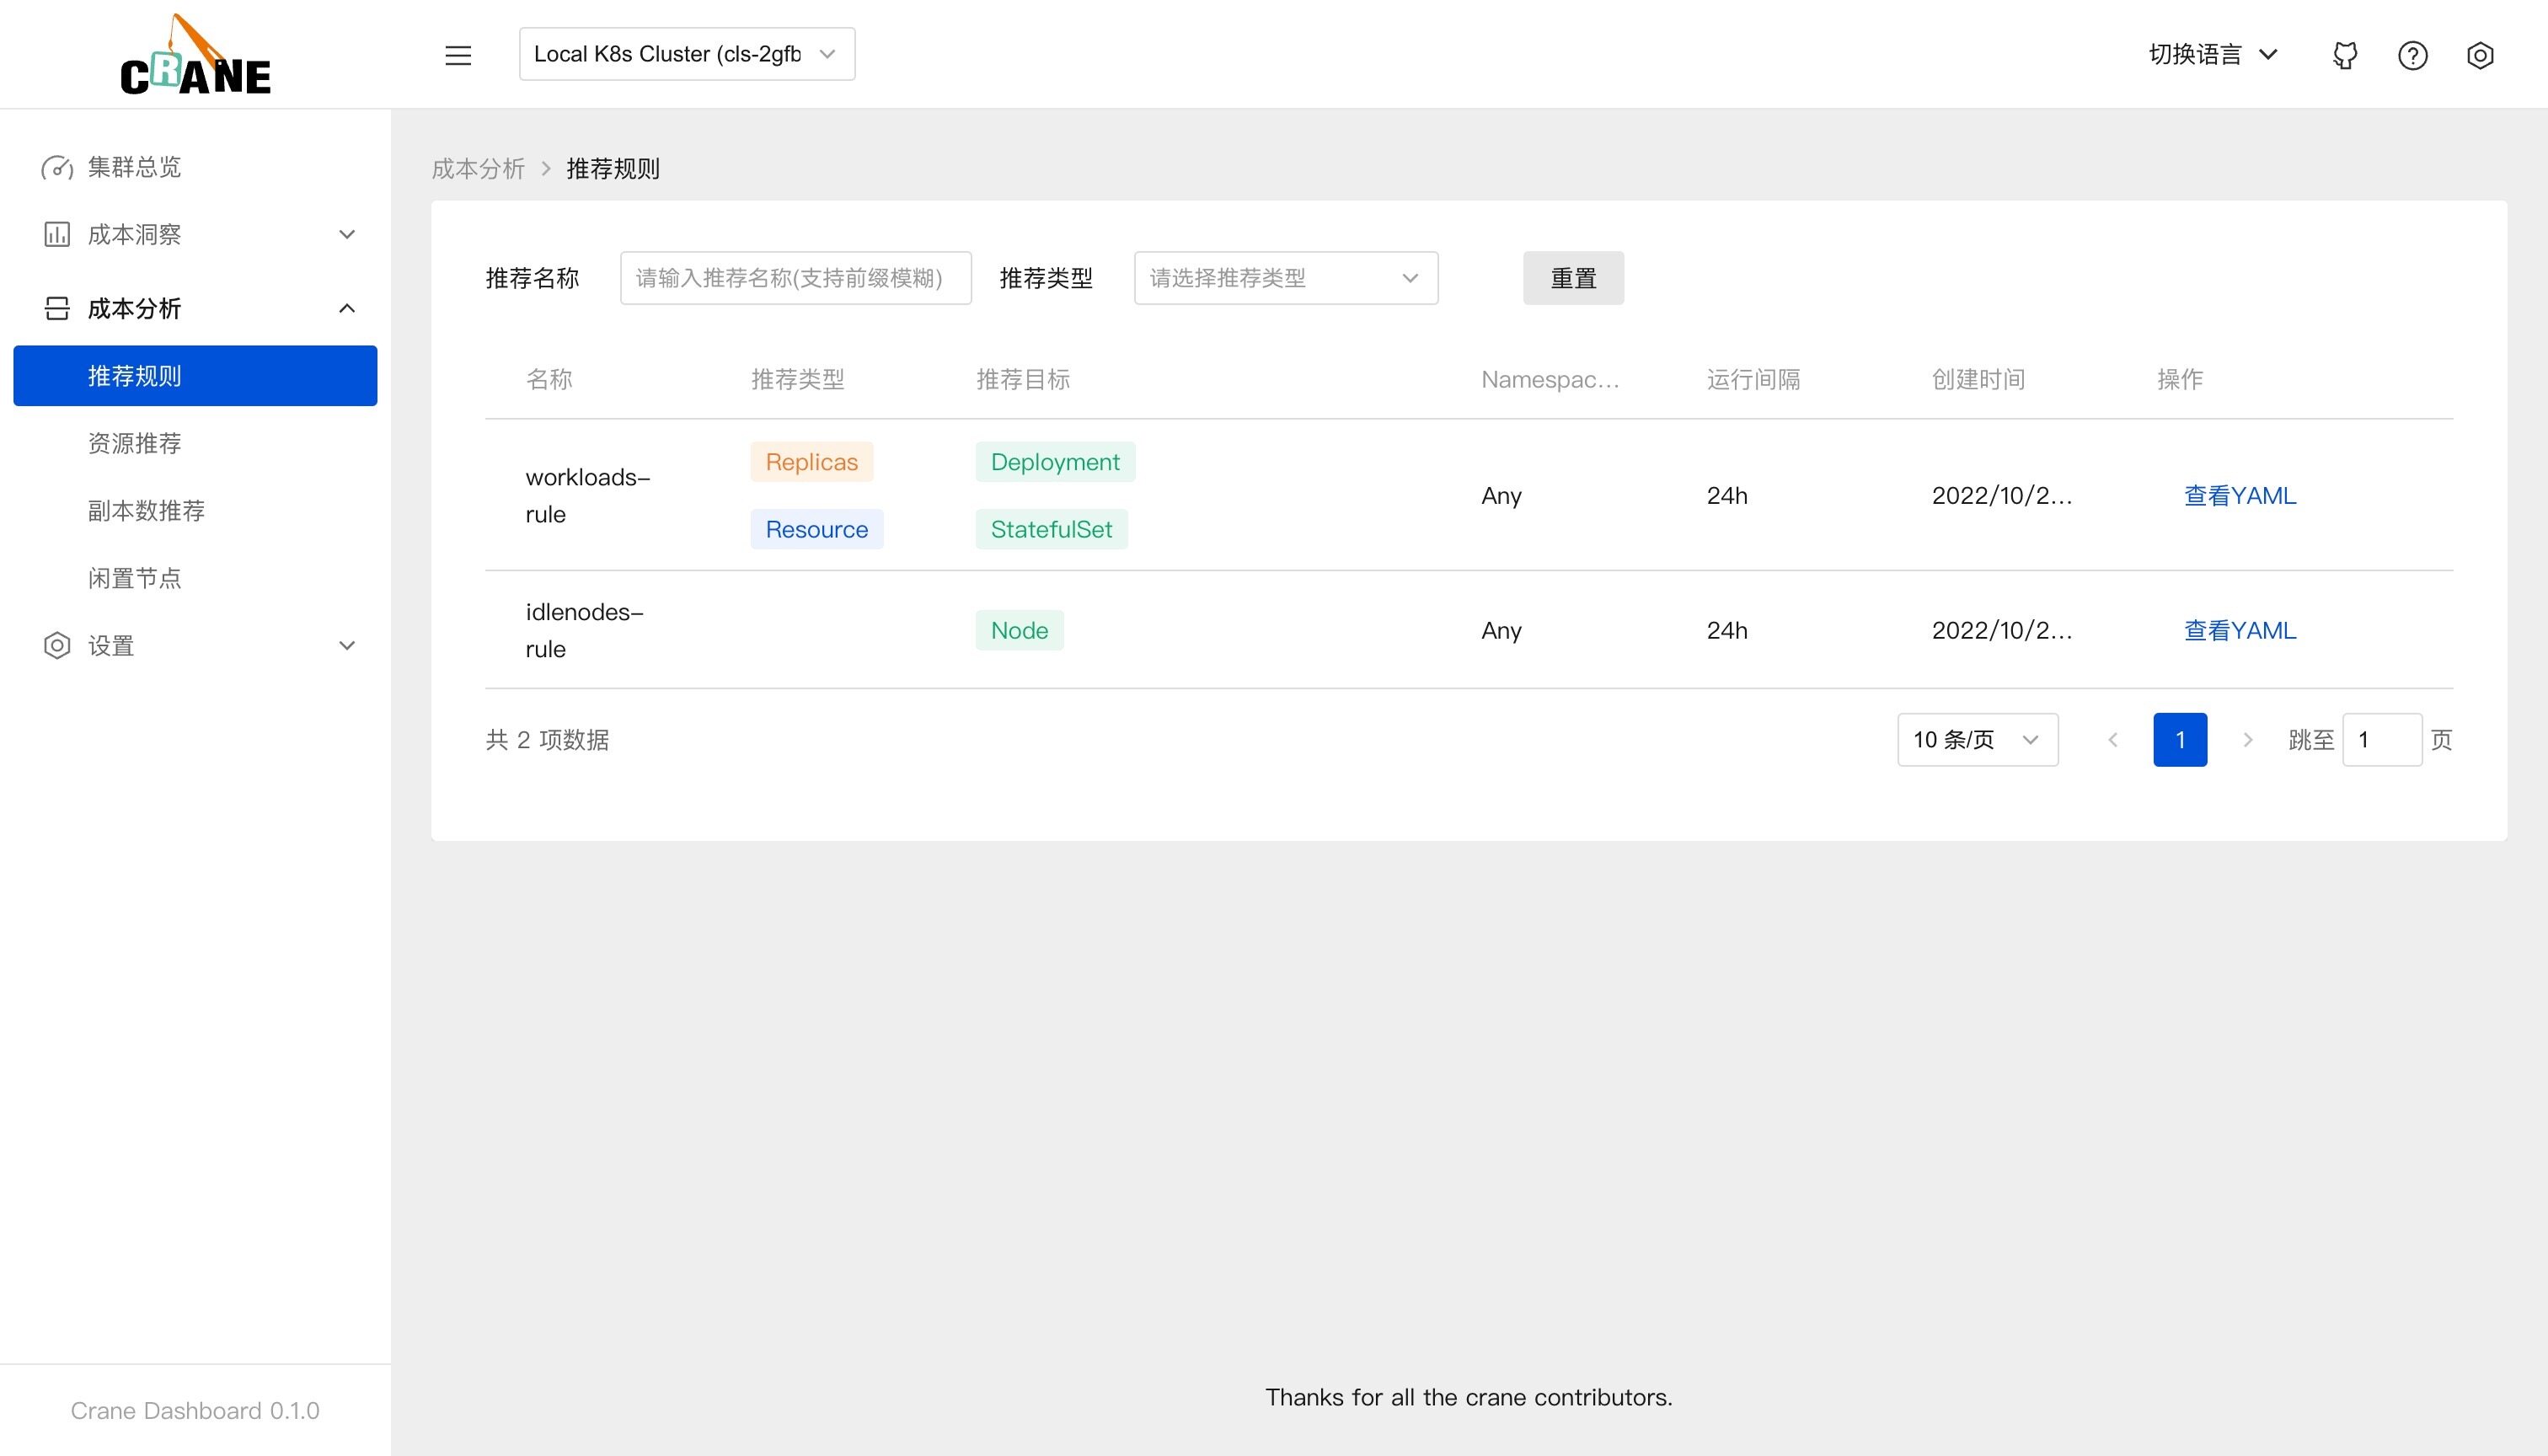
这些推荐规则实际上是安装在 K8s 集群上的 RecommendationRule CRD 对象:
$ kubectl get RecommendationRule
NAME             RUNINTERVAL   AGE
idlenodes-rule   24h           16m
workloads-rule   24h           16m
workloads-rule 这个推荐规则的资源对象如下所示:
apiVersion: analysis.crane.io/v1alpha1
kind: RecommendationRule
metadata:
  name: workloads-rule
  labels:
    analysis.crane.io/recommendation-rule-preinstall: 'true'
spec:
  resourceSelectors:
    - kind: Deployment
      apiVersion: apps/v1
    - kind: StatefulSet
      apiVersion: apps/v1
  namespaceSelector:
    any: true
  runInterval: 24h
  recommenders:
    - name: Replicas
    - name: Resource
RecommendationRule 是一个全部范围内的对象,该推荐规则会对所有命名空间中的 Deployments 和 StatefulSets 做资源推荐和副本数推荐。相关规范属性如下所示:
每隔 24 小时运行一次分析推荐,
runInterval格式为时间间隔,比如: 1h,1m,设置为空表示只运行一次。待分析的资源通过配置
resourceSelectors数组设置,每个resourceSelector通过kind、apiVersion、name选择 K8s 中的资源,当不指定 name 时表示在namespaceSelector基础上的所有资源。namespaceSelector定义了待分析资源的命名空间,any: true表示选择所有命名空间。recommenders定义了待分析的资源需要通过哪些Recommender进行分析。目前支持两种Recommender:- 资源推荐(Resource): 通过 VPA 算法分析应用的真实用量推荐更合适的资源配置
- 副本数推荐(Replicas): 通过 HPA 算法分析应用的真实用量推荐更合适的副本数量
资源推荐
Kubernetes 用户在创建应用资源时常常是基于经验值来设置 request 和 limit,通过资源推荐的算法分析应用的真实用量推荐更合适的资源配置,你可以参考并采纳它提升集群的资源利用率。该推荐算法模型采用了 VPA 的滑动窗口(Moving Window)算法进行推荐:
- 通过监控数据,获取 Workload 过去一周(可配置)的 CPU 和内存的历史用量。
- 算法考虑数据的时效性,较新的数据采样点会拥有更高的权重。
- CPU 推荐值基于用户设置的目标百分位值计算,内存推荐值基于历史数据的最大值。
副本数推荐
Kubernetes 用户在创建应用资源时常常是基于经验值来设置副本数。通过副本数推荐的算法分析应用的真实用量推荐更合适的副本配置,同样可以参考并采纳它提升集群的资源利用率。其实现的基本算法是基于工作负载历史 CPU 负载,找到过去七天内每小时负载最低的 CPU 用量,计算按 50%(可配置)利用率和工作负载 CPU Request 应配置的副本数。
当我们部署 crane 的时候会在同一个命名空间中创建一个名为 recommendation-configuration 的 ConfigMap 对象,包含一个 yaml 格式的 RecommendationConfiguration,该配置订阅了 recommender 的配置,如下所示:
$ kubectl get cm recommendation-configuration -n crane-system -oyaml
apiVersion: v1
data:
  config.yaml: |-
    apiVersion: analysis.crane.io/v1alpha1
    kind: RecommendationConfiguration
    recommenders:
      - name: Replicas  # 副本数推荐
        acceptedResources:
          - kind: Deployment
            apiVersion: apps/v1
          - kind: StatefulSet
            apiVersion: apps/v1
      - name: Resource  # 资源推荐
        acceptedResources:
          - kind: Deployment
            apiVersion: apps/v1
          - kind: StatefulSet
            apiVersion: apps/v1
kind: ConfigMap
metadata:
  name: recommendation-configuration
  namespace: crane-system
需要注意的是资源类型和 recommenders 需要可以匹配,比如 Resource 推荐默认只支持 Deployments 和 StatefulSets。
同样的也可以再查看一次闲置节点推荐规则的资源对象,如下所示:
$ kubectl get recommendationrule idlenodes-rule -oyaml
apiVersion: analysis.crane.io/v1alpha1
kind: RecommendationRule
metadata:
  labels:
    analysis.crane.io/recommendation-rule-preinstall: "true"
  name: idlenodes-rule
spec:
  namespaceSelector:
    any: true
  recommenders:
  - name: IdleNode
  resourceSelectors:
  - apiVersion: v1
    kind: Node
  runInterval: 24h
创建 RecommendationRule 配置后,RecommendationRule 控制器会根据配置定期运行推荐任务,给出优化建议生成 Recommendation 对象,然后我们可以根据优化建议 Recommendation 调整资源配置。
比如我们这里集群中已经生成了多个优化建议 Recommendation 对象。
$ kubectl get recommendations
NAME                            TYPE       TARGETKIND    TARGETNAMESPACE   TARGETNAME       STRATEGY   PERIODSECONDS   ADOPTIONTYPE          AGE
workloads-rule-resource-8whzs   Resource   StatefulSet   default           nacos            Once                       StatusAndAnnotation   34m
workloads-rule-resource-hx4cp   Resource   StatefulSet   default           redis-replicas   Once                       StatusAndAnnotation   34m
# ......
可以随便查看任意一个优化建议对象。
$ kubectl get recommend workloads-rule-resource-g7nwp -n crane-system -oyaml
apiVersion: analysis.crane.io/v1alpha1
kind: Recommendation
metadata:
  name: workloads-rule-resource-g7nwp
  namespace: crane-system
spec:
  adoptionType: StatusAndAnnotation
  completionStrategy:
    completionStrategyType: Once
  targetRef:
    apiVersion: apps/v1
    kind: Deployment
    name: fadvisor
    namespace: crane-system
  type: Resource
status:
  action: Patch
  conditions:
  - lastTransitionTime: "2022-10-20T07:43:49Z"
    message: Recommendation is ready
    reason: RecommendationReady
    status: "True"
    type: Ready
  currentInfo: '{"spec":{"template":{"spec":{"containers":[{"name":"fadvisor","resources":{"requests":{"cpu":"0","memory":"0"}}}]}}}}'
  lastUpdateTime: "2022-10-20T07:43:49Z"
  recommendedInfo: '{"spec":{"template":{"spec":{"containers":[{"name":"fadvisor","resources":{"requests":{"cpu":"114m","memory":"120586239"}}}]}}}}'
  recommendedValue: |
    resourceRequest:
      containers:
      - containerName: fadvisor
        target:
          cpu: 114m
          memory: "120586239"
  targetRef: {}
在 dashboard 的资源推荐页面也能查看到优化建议列表。
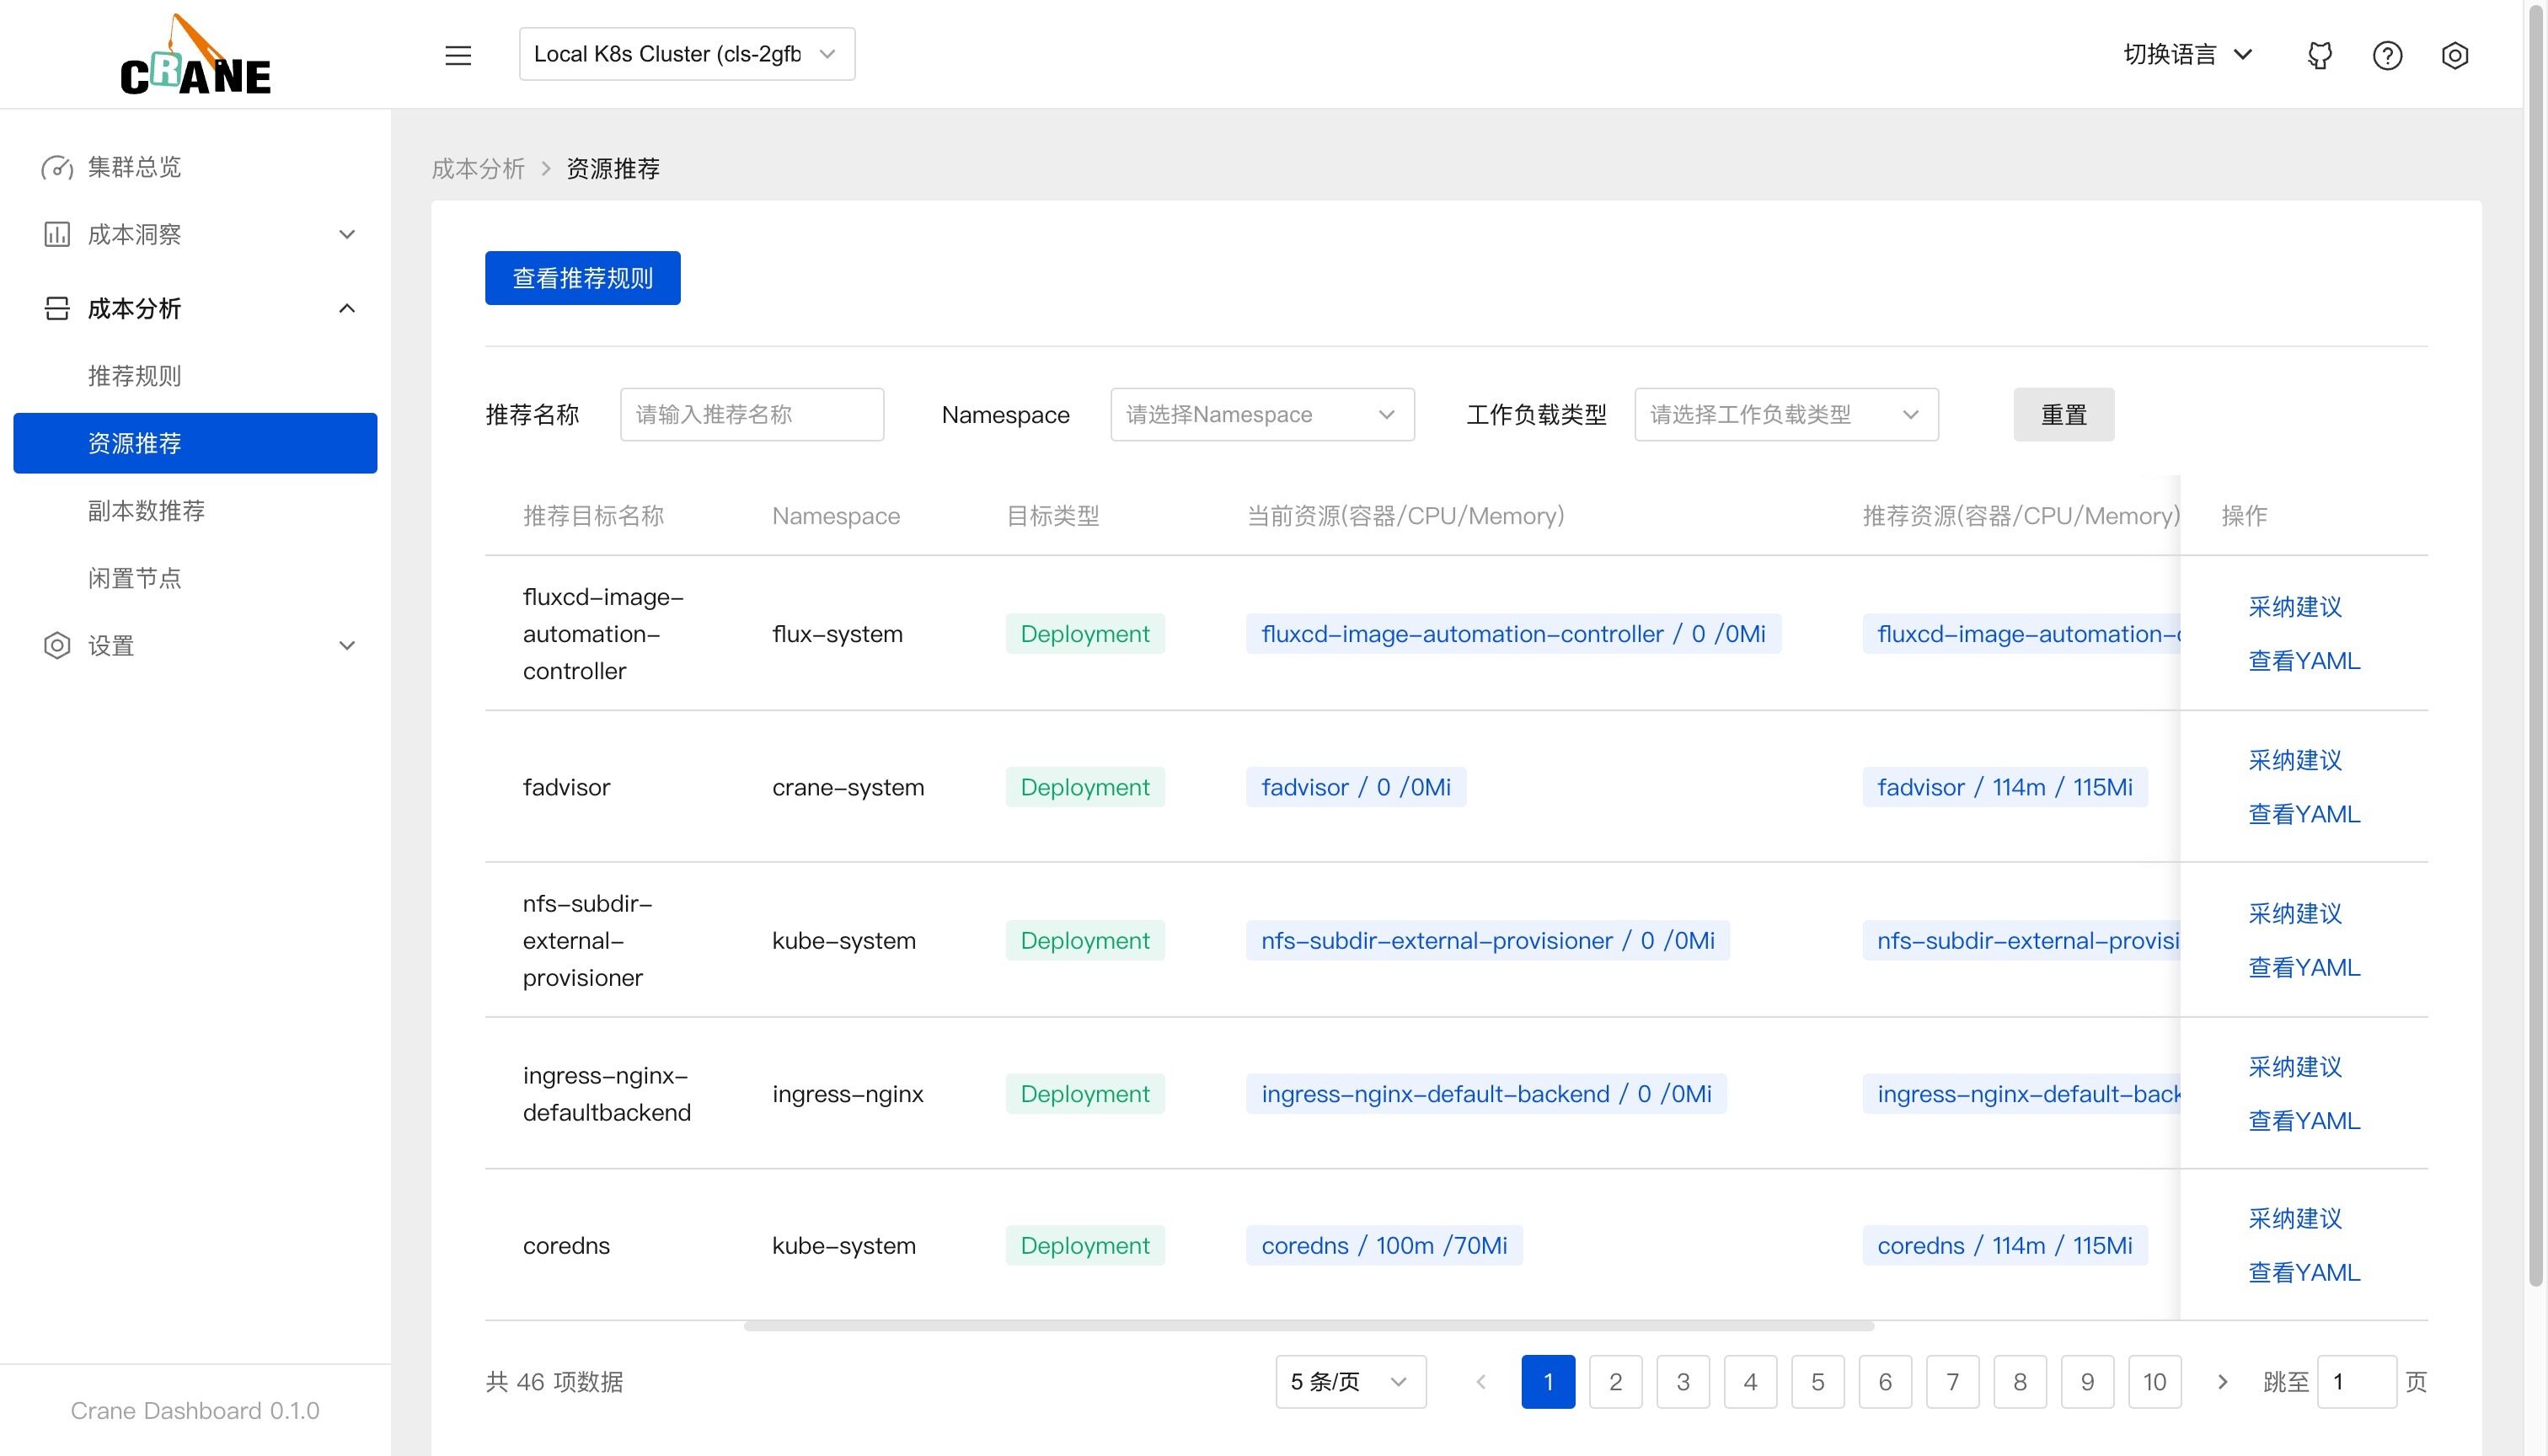
在页面中可以看到当前资源(容器/CPU/Memory)与推荐的资源数据,点击采纳建议即可获取优化的执行命令。
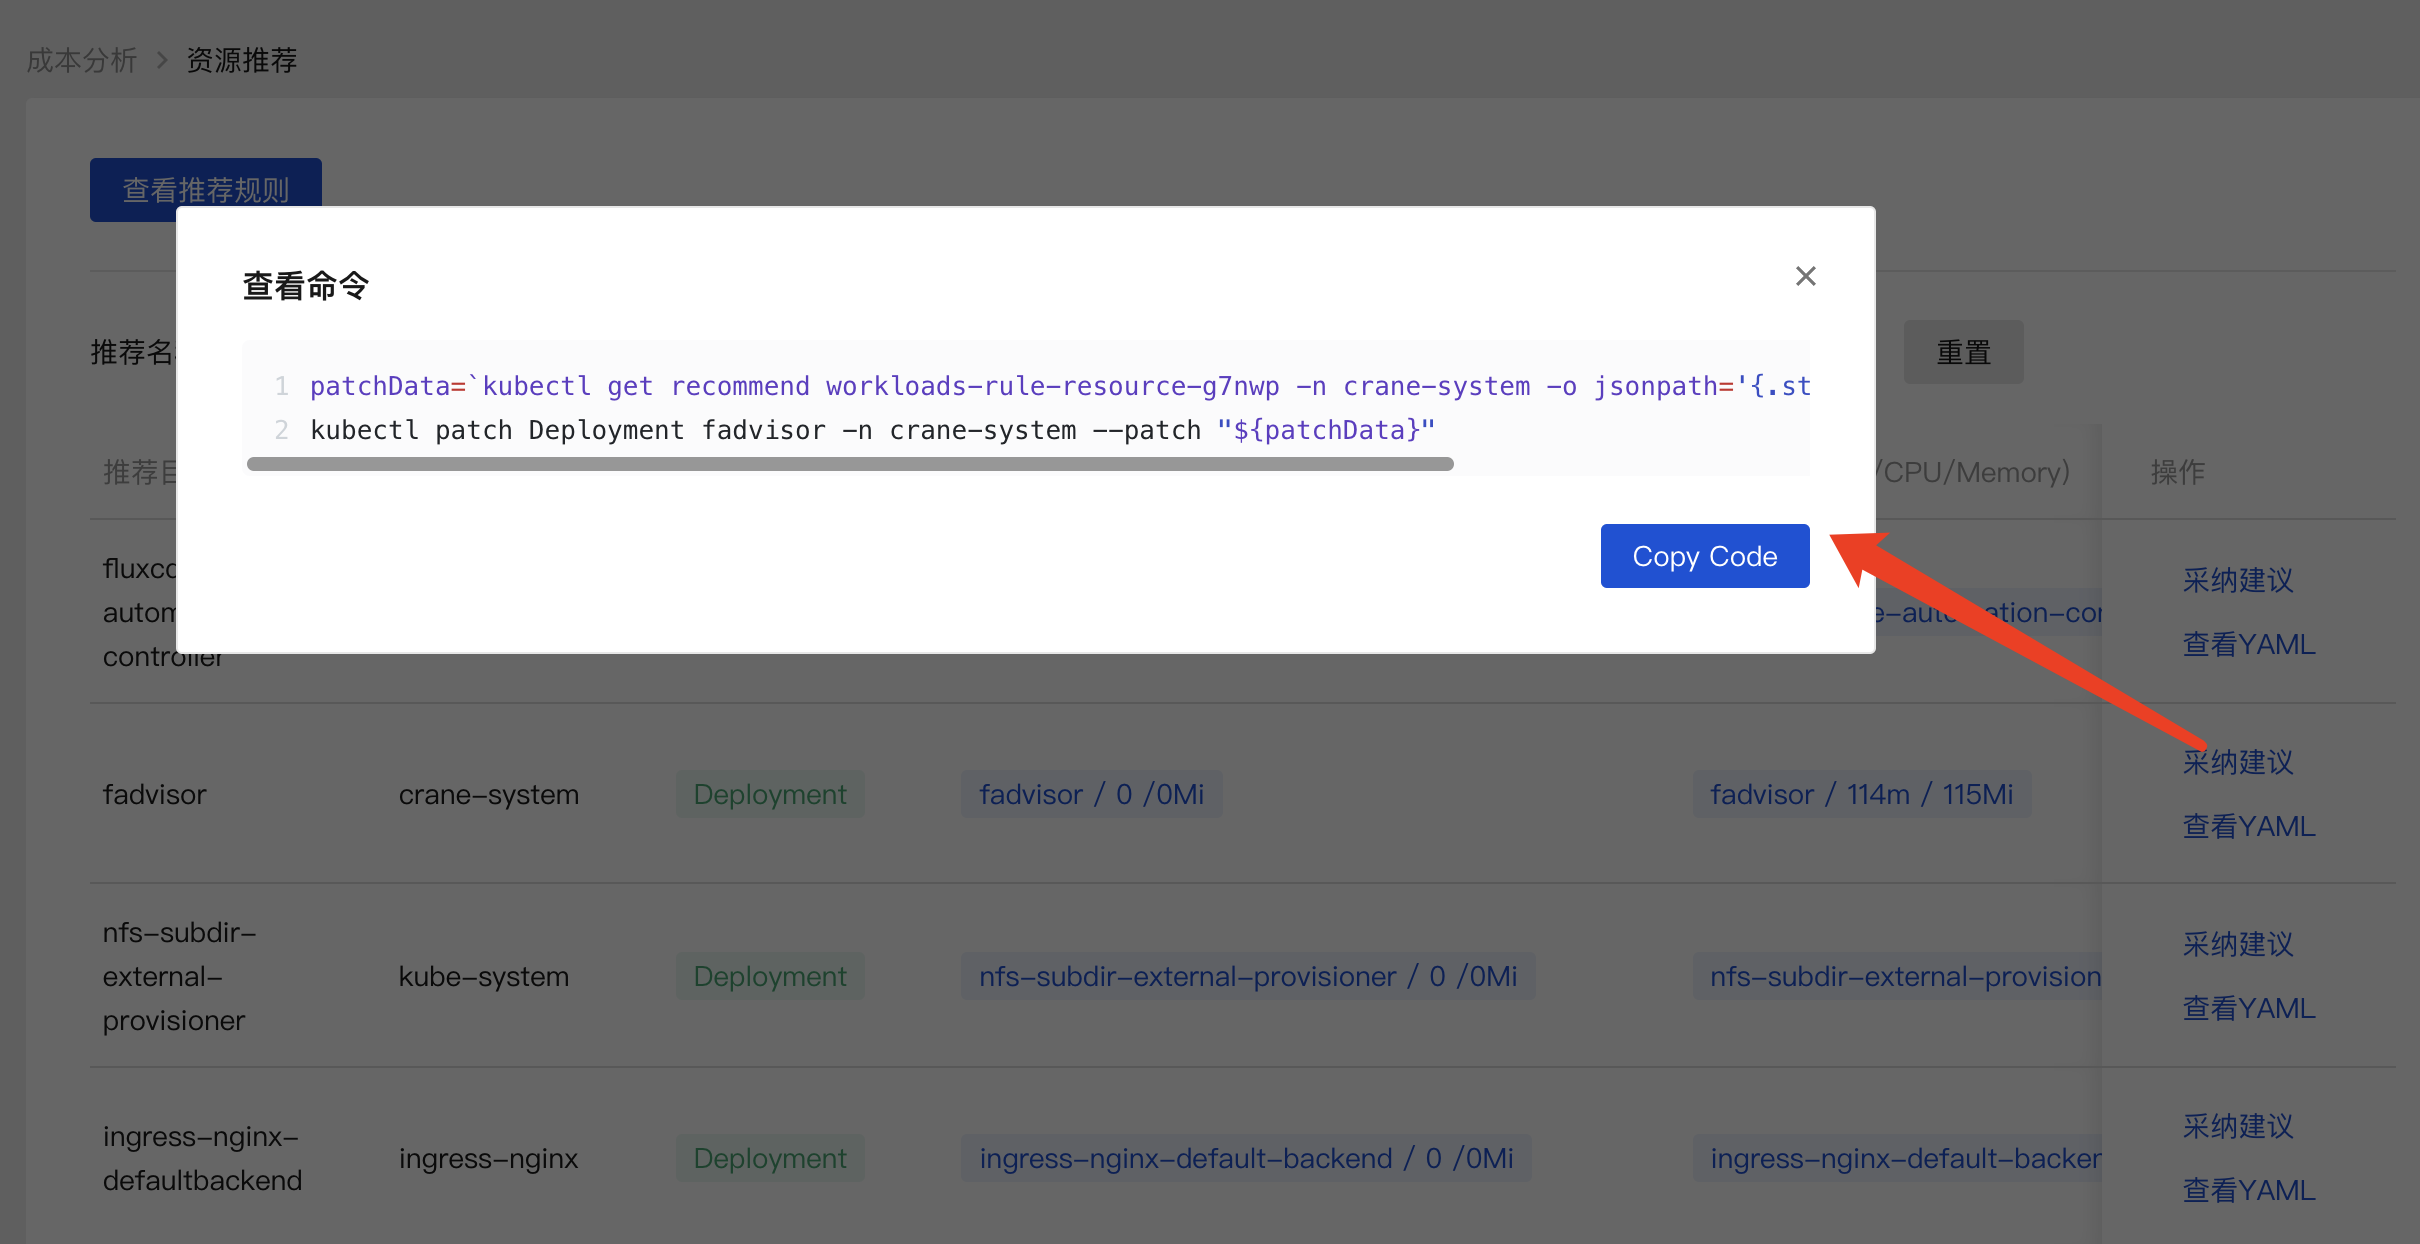
执行命令即可完成优化,其实就是修改资源对象的 resources 资源数据。
patchData=`kubectl get recommend workloads-rule-resource-g7nwp -n crane-system -o jsonpath='{.status.recommendedInfo}'`;kubectl patch Deployment fadvisor -n crane-system --patch "${patchData}"
对于闲置节点推荐,由于节点的下线在不同平台上的步骤不同,用户可以根据自身需求进行节点的下线或者缩容。
应用在监控系统(比如 Prometheus)中的历史数据越久,推荐结果就越准确,建议生产上超过两周时间。对新建应用的预测往往不准。
自定义推荐
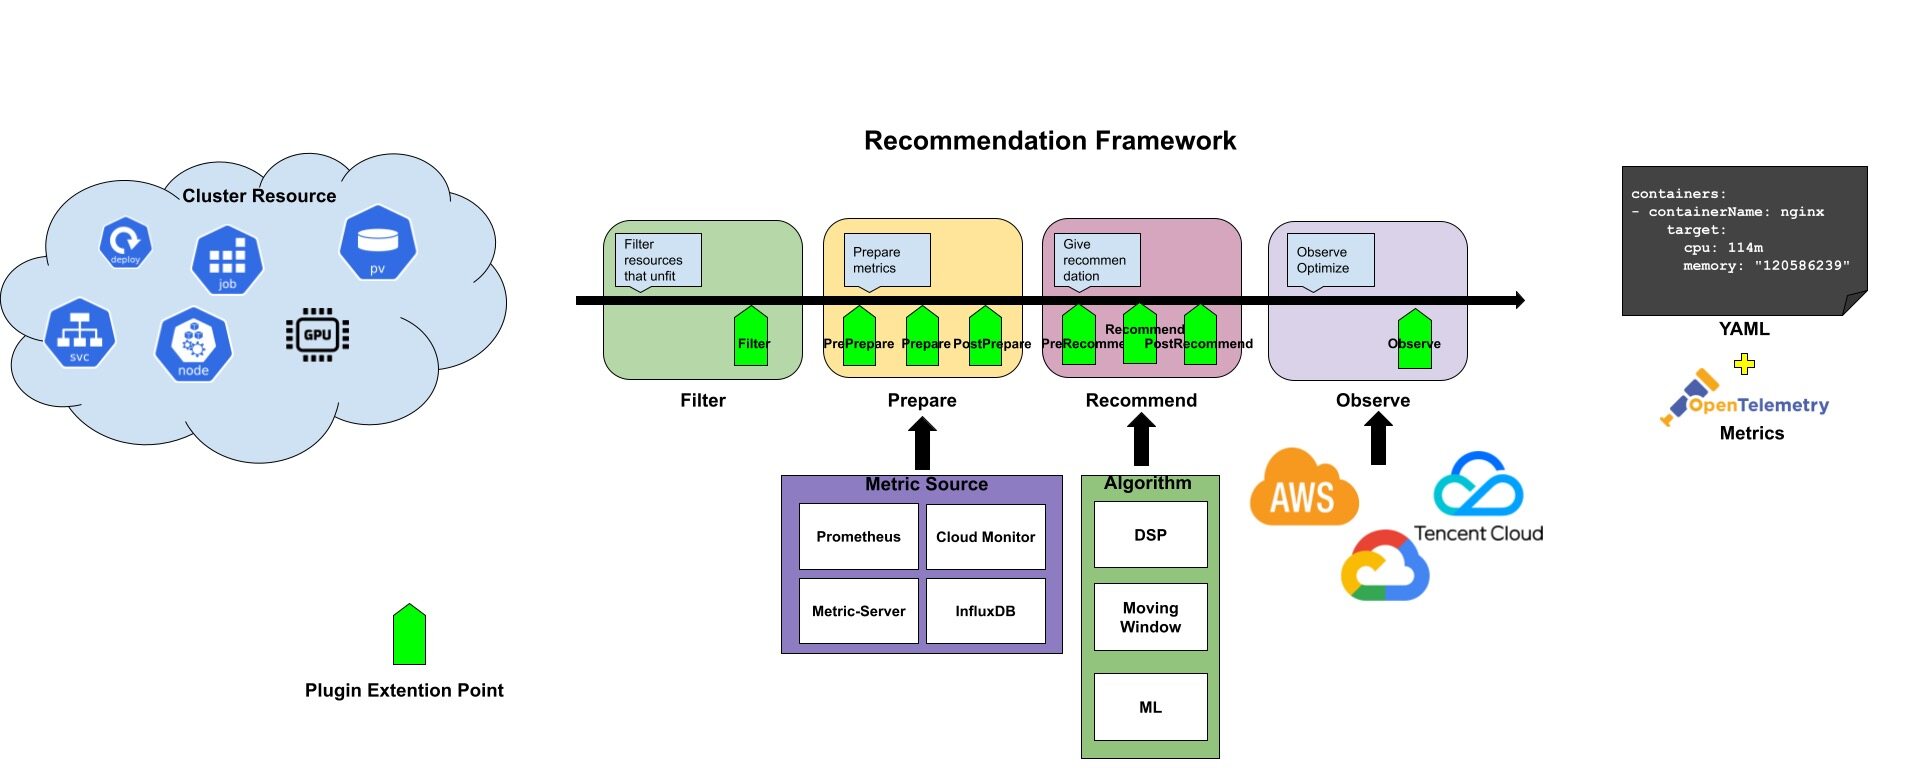
Recommendation Framework 提供了一套可扩展的 Recommender 框架并支持了内置的 Recommender,用户可以实现一个自定义的 Recommender,或者修改一个已有的 Recommender。
和 K8s 调度框架类似,Recommender 接口定义了一次推荐需要实现的四个阶段和八个扩展点,这些扩展点会在推荐过程中按顺序被调用。这些扩展点中的一些可以改变推荐决策,而另一些仅用来提供信息。
Recommender 接口定义如下所示:
type Recommender interface {
    Name() string
    framework.Filter
    framework.PrePrepare
    framework.Prepare
    framework.PostPrepare
    framework.PreRecommend
    framework.Recommend
    framework.PostRecommend
    framework.Observe
}

// Phase: Filter
type Filter interface {
    // Filter 将过滤无法通过目标推荐器推荐的资源
    Filter(ctx *RecommendationContext) error
}

// Phase: Prepare
type PrePrepare interface {
    CheckDataProviders(ctx *RecommendationContext) error
}

type Prepare interface {
    CollectData(ctx *RecommendationContext) error
}

type PostPrepare interface {
    PostProcessing(ctx *RecommendationContext) error
}

type PreRecommend interface {
    PreRecommend(ctx *RecommendationContext) error
}

// Phase: Recommend
type Recommend interface {
    Recommend(ctx *RecommendationContext) error
}

type PostRecommend interface {
    Policy(ctx *RecommendationContext) error
}

// Phase: Observe
type Observe interface {
    Observe(ctx *RecommendationContext) error
}
整个推荐过程分成了四个阶段:Filter、Prepare、Recommend、Observe,阶段的输入是需要分析的 Kubernetes 资源,输出是推荐的优化建议。接口中的 RecommendationContext 保存了一次推荐过程中的上下文,包括推荐目标、RecommendationConfiguration 等信息,我们可以根据自身需求增加更多的内容。
Filter:Filter 阶段用于预处理推荐数据,通常,在预处理时需判断推荐目标是否和 Recommender 匹配,比如资源推荐默认只支持处理 Deployment 和 StatefulSet。除此之外,还可以判断推荐目标状态是否适合推荐,比如是否删除中,是否刚创建等。当返回 error 会终止此次推荐。
Prepare:Prepare 阶段用于数据准备,请求外部监控系统并将时序数据保存在上下文中。
PrePrepare扩展点用于检测监控系统的链接情况Prepare扩展点用于查询时序数据PostPrepare扩展点用于对时序数据的数据处理,比如:应用冷启动的异常数据,部分数据的缺失,数据聚合,异常数据清理等。
Recommend:Recommend 阶段用于基于时序数据和资源配置进行优化建议,优化建议的类型取决于推荐的类型。比如,如果是资源推荐,那么输出就是 K8s workload 的资源配置。
Recommend扩展点用于采用 Crane 的算法模块对数据进行分析计算PostRecommend扩展点对分析结果进行最后处理
Observe:Observe 阶段用于推荐结果的可观测。比如,在资源推荐时,将优化建议的信息通过 Metric 保存到监控系统,再通过 Dashboard 观测优化建议带来的收益。
比如资源推荐就实现了 Recommender 接口,主要做了下面 3 个阶段的处理:
- Filter 阶段:过滤没有 Pod 的工作负载
- Recommend 推荐:采用 VPA 的滑动窗口算法分别计算每个容器的 CPU 和内存并给出对应的推荐值
- Observe 推荐:将推荐资源配置记录到
crane_analytics_replicas_recommendation指标
除了核心的智能推荐功能之外,Crane 还有很多高级特性,比如可以根据实际的节点利用率的动态调度器、基于流量预测的弹性 HPA 等等。
智能调度器
Crane 除了提供了智能推荐功能之外,还提供了一个调度器插件 Crane-scheduler 可以实现智能调度和完成拓扑感知调度与资源分配的工作。
动态调度器
K8s 的原生调度器只能通过资源的 requests 值来调度 pod,这很容易造成一系列负载不均的问题:
- 对于某些节点,实际负载与资源请求相差不大,这会导致很大概率出现稳定性问题。
- 对于其他节点来说,实际负载远小于资源请求,这将导致资源的巨大浪费。
为了解决这些问题,动态调度器根据实际的节点利用率构建了一个简单但高效的模型,并过滤掉那些负载高的节点来平衡集群。
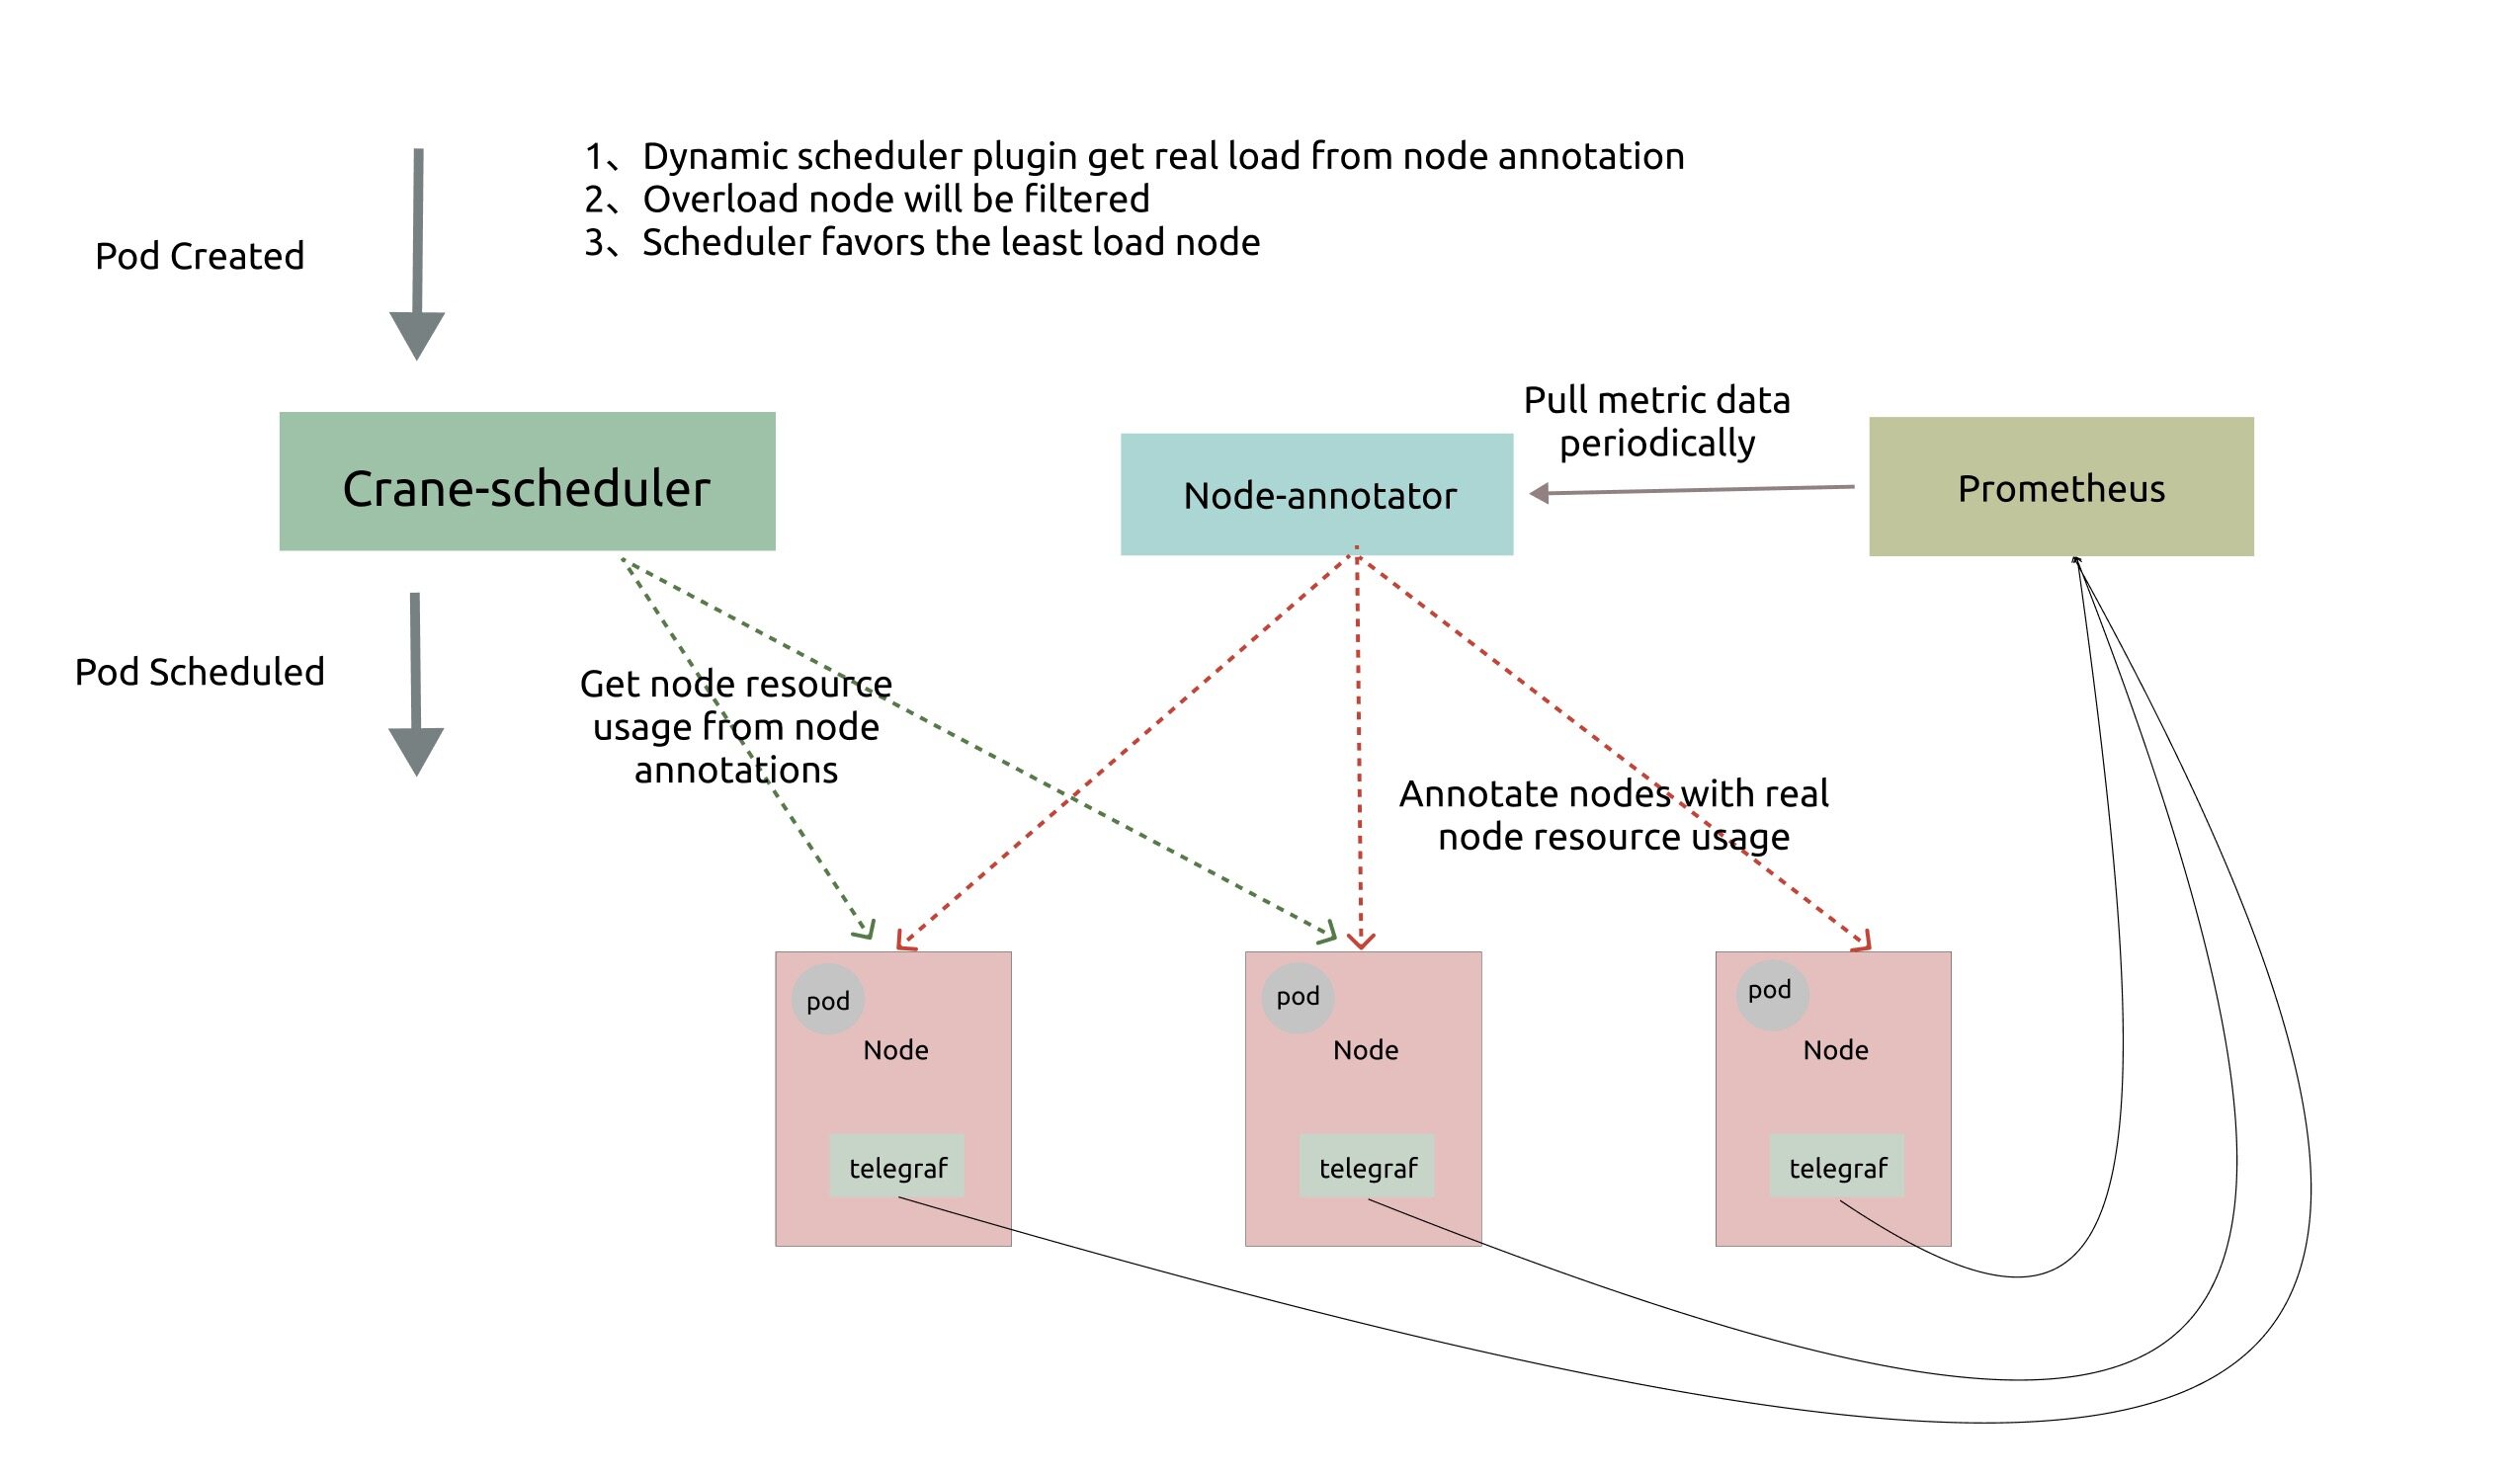
动态调度器依赖于 prometheus 和 node-exporter 收集汇总指标数据,它由两个组件组成:
Node-annotator定期从 Prometheus 拉取数据,并以 annotations 的形式在节点上用时间戳标记它们。Dynamic plugin直接从节点的 annotations 中读取负载数据,过滤并基于简单的算法对候选节点进行评分。
动态调度器提供了一个默认值调度策略,配置文件如下所示:
# policy.yaml
apiVersion: scheduler.policy.crane.io/v1alpha1
 kind: DynamicSchedulerPolicy
 spec:
   syncPolicy:
     ##cpu usage
     - name: cpu_usage_avg_5m
       period: 3m
     - name: cpu_usage_max_avg_1h
       period: 15m
     - name: cpu_usage_max_avg_1d
       period: 3h
     ##memory usage
     - name: mem_usage_avg_5m
       period: 3m
     - name: mem_usage_max_avg_1h
       period: 15m
     - name: mem_usage_max_avg_1d
       period: 3h

   predicate:
     ##cpu usage
     - name: cpu_usage_avg_5m
       maxLimitPecent: 0.65
     - name: cpu_usage_max_avg_1h
       maxLimitPecent: 0.75
     ##memory usage
     - name: mem_usage_avg_5m
       maxLimitPecent: 0.65
     - name: mem_usage_max_avg_1h
       maxLimitPecent: 0.75

   priority:
     ##cpu usage
     - name: cpu_usage_avg_5m
       weight: 0.2
     - name: cpu_usage_max_avg_1h
       weight: 0.3
     - name: cpu_usage_max_avg_1d
       weight: 0.5
     ##memory usage
     - name: mem_usage_avg_5m
       weight: 0.2
     - name: mem_usage_max_avg_1h
       weight: 0.3
     - name: mem_usage_max_avg_1d
       weight: 0.5

   hotValue:
     - timeRange: 5m
       count: 5
     - timeRange: 1m
       count: 2
我们可以根据实际需求自定义该策略配置,默认策略依赖于以下指标:
- cpu_usage_avg_5m
- cpu_usage_max_avg_1h
- cpu_usage_max_avg_1d
- mem_usage_avg_5m
- mem_usage_max_avg_1h
- mem_usage_max_avg_1d
这几个指标我们这里是通过记录规则创建的,可以查看 Prometheus 的配置文件来了解详细信息:
$ kubectl get cm -n crane-system prometheus-server -oyaml
apiVersion: v1
data:
  alerting_rules.yml: |
    {}
  alerts: |
    {}
  allow-snippet-annotations: "false"
  prometheus.yml: |
    global:
      evaluation_interval: 1m
      scrape_interval: 1m
      scrape_timeout: 10s
    rule_files:
    - /etc/config/recording_rules.yml
    - /etc/config/alerting_rules.yml
    - /etc/config/rules
    - /etc/config/alerts
    scrape_configs:
    - job_name: prometheus
      static_configs:
      - targets:
        - localhost:9090
    # ......
  recording_rules.yml: |
    groups:
    - interval: 3600s
      name: costs.rules
      rules:
    #   ......
    - interval: 30s
      name: scheduler.rules.30s
      rules:
      - expr: 100 - (avg by (instance) (irate(node_cpu_seconds_total{mode="idle"}[90s]))
          * 100)
        record: cpu_usage_active
      - expr: 100*(1-node_memory_MemAvailable_bytes/node_memory_MemTotal_bytes)
        record: mem_usage_active
    - interval: 1m
      name: scheduler.rules.1m
      rules:
      - expr: avg_over_time(cpu_usage_active[5m])
        record: cpu_usage_avg_5m
      - expr: avg_over_time(mem_usage_active[5m])
        record: mem_usage_avg_5m
    - interval: 5m
      name: scheduler.rules.5m
      rules:
      - expr: max_over_time(cpu_usage_avg_5m[1h])
        record: cpu_usage_max_avg_1h
      - expr: max_over_time(cpu_usage_avg_5m[1d])
        record: cpu_usage_max_avg_1d
      - expr: max_over_time(mem_usage_avg_5m[1h])
        record: mem_usage_max_avg_1h
      - expr: max_over_time(mem_usage_avg_5m[1d])
        record: mem_usage_max_avg_1d
  rules: |
    {}
kind: ConfigMap
metadata:
  name: prometheus-server
  namespace: crane-system
在调度的 Filter 阶段,如果该节点的实际使用率大于上述任一指标的阈值,则该节点将被过滤。而在 Score 阶段,最终得分是这些指标值的加权和。
在生产集群中,可能会频繁出现调度热点,因为创建 Pod 后节点的负载不能立即增加。因此,我们定义了一个额外的指标,名为 hotValue,表示节点最近几次的调度频率,并且节点的最终优先级是最终得分减去 hotValue。
我们可以在 K8s 集群中安装 Crane-scheduler 作为第二个调度器来进行验证:
$ helm repo add crane https://finops-helm.pkg.coding.net/gocrane/gocrane
$ helm upgrade --install scheduler -n crane-system --create-namespace --set global.prometheusAddr="http://prometheus-server.crane-system.svc.cluster.local:8080" crane/scheduler
安装后会创建一个名为 scheduler-config 的 ConfigMap 对象,里面包含的就是调度器的配置文件,我们会在配置中启用 Dynamic 动态调度插件:
$ kubectl get cm -n crane-system scheduler-config -oyaml
apiVersion: v1
data:
  scheduler-config.yaml: |
    apiVersion: kubescheduler.config.k8s.io/v1beta2
    kind: KubeSchedulerConfiguration
    leaderElection:
      leaderElect: false
    profiles:
    - schedulerName: crane-scheduler
      plugins:
        filter:
          enabled:
          - name: Dynamic
        score:
          enabled:
          - name: Dynamic
            weight: 3
      pluginConfig:
      - name: Dynamic
        args:
          policyConfigPath: /etc/kubernetes/policy.yaml
kind: ConfigMap
metadata:
  name: scheduler-config
  namespace: crane-system
安装完成后我们可以任意创建一个 Pod,并通过设置 schedulerName: crane-scheduler 属性明确指定使用该调度器进行调度,如下所示:
apiVersion: apps/v1
kind: Deployment
metadata:
  name: cpu-stress
spec:
  selector:
    matchLabels:
      app: cpu-stress
  replicas: 1
  template:
    metadata:
      labels:
        app: cpu-stress
    spec:
      schedulerName: crane-scheduler
      hostNetwork: true
      tolerations:
        - key: node.kubernetes.io/network-unavailable
          operator: Exists
          effect: NoSchedule
      containers:
        - name: stress
          image: docker.io/gocrane/stress:latest
          command: ['stress', '-c', '1']
          resources:
            requests:
              memory: '1Gi'
              cpu: '1'
            limits:
              memory: '1Gi'
              cpu: '1'
直接创建上面的资源对象,正常创建的 Pod 就会通过 Crane Scheduler 调度器进行调度了:
Events:
  Type    Reason     Age   From             Message
  ----    ------     ----  ----             -------
  Normal  Scheduled  22s   crane-scheduler  Successfully assigned default/cpu-stress-cc8656b6c-hsqdg to node2
  Normal  Pulling    22s   kubelet          Pulling image "docker.io/gocrane/stress:latest"
如果想默认使用该动态调度器,则可以使用该调度器去替换掉默认的调度器即可。
使用拓扑感知调度对 Pod 进行精细化调度
Crane-Scheduler 和 Crane-Agent 配合工作可以完成拓扑感知调度与资源分配的工作。Crane-Agent 从节点采集资源拓扑,包括 NUMA、Socket、设备等信息,汇总到 NodeResourceTopology 这个自定义资源对象中。
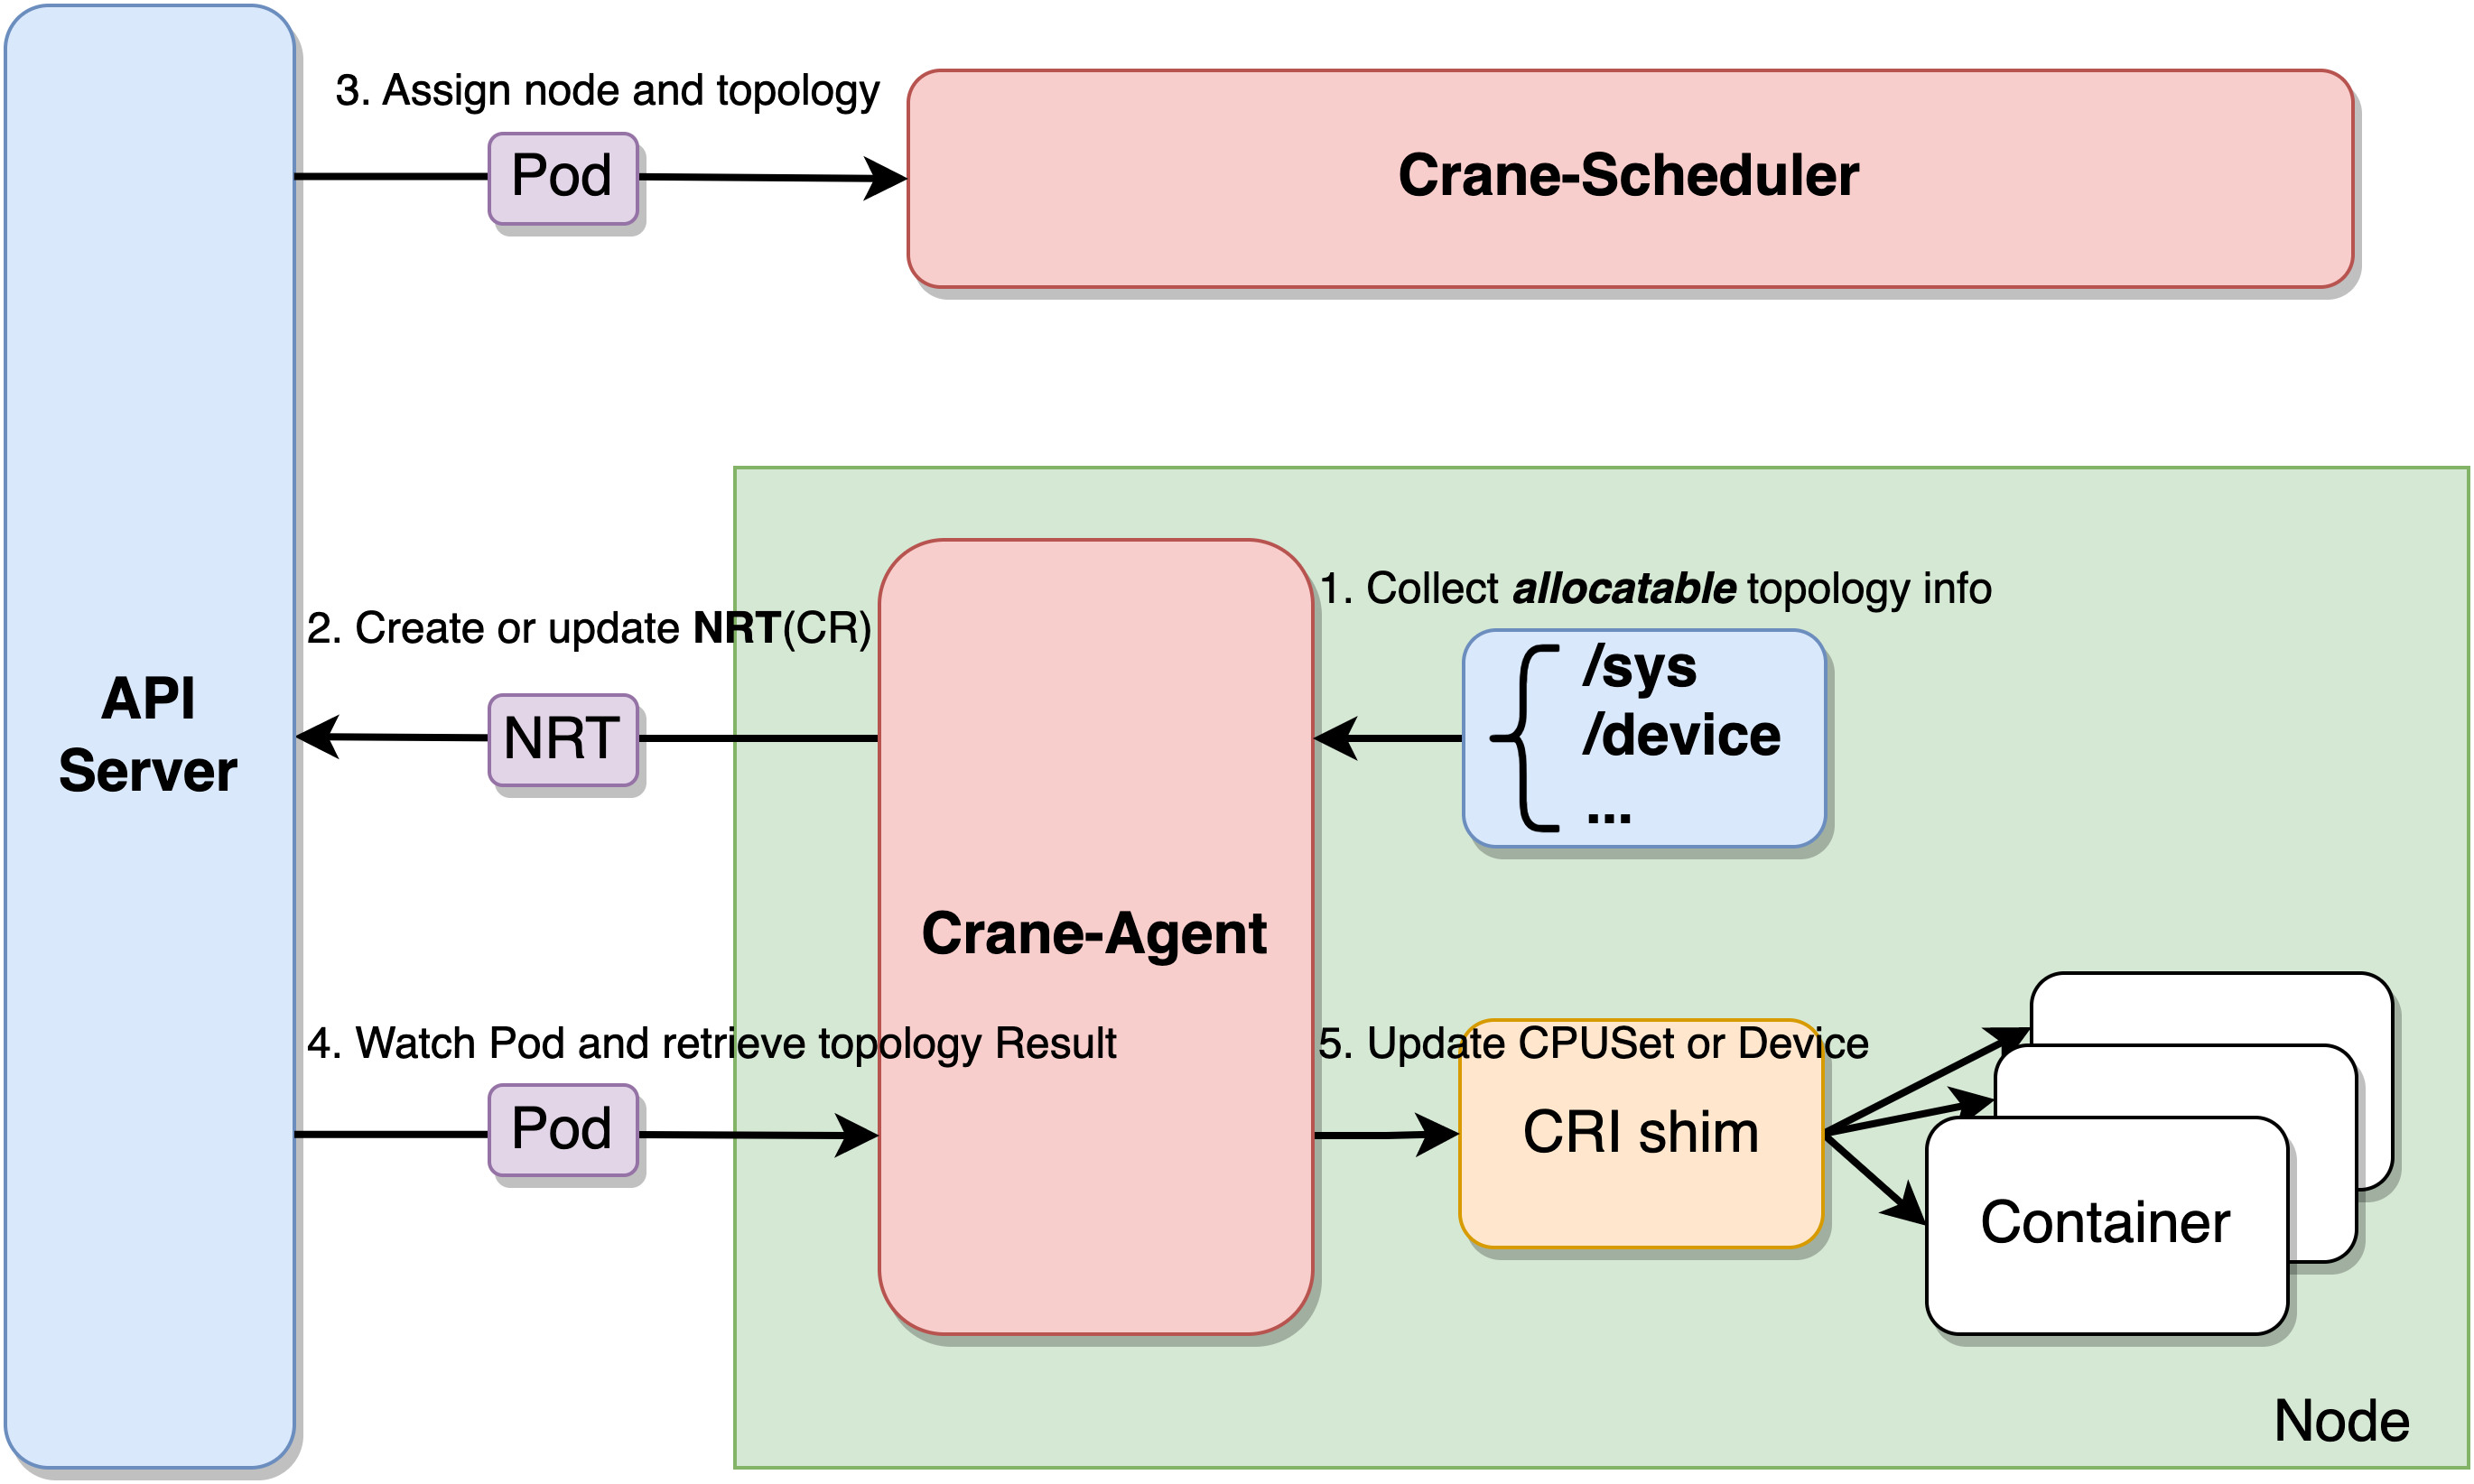
Crane-Scheduler 在调度时会参考节点的 NodeResourceTopology 对象获取到节点详细的资源拓扑结构,在调度到节点的同时还会为 Pod 分配拓扑资源,并将结果写到 Pod 的 annotations 中。Crane-Agent 在节点上 Watch 到 Pod 被调度后,从 Pod 的 annotations 中获取到拓扑分配结果,并按照用户给定的 CPU 绑定策略进行 CPUSet 的细粒度分配。
Crane 中提供了四种 CPU 分配策略,分别如下:
none:该策略不进行特别的 CPUSet 分配,Pod 会使用节点 CPU 共享池。exclusive:该策略对应 kubelet 的 static 策略,Pod 会独占 CPU 核心,其他任何 Pod 都无法使用。numa:该策略会指定 NUMA Node,Pod 会使用该 NUMA Node 上的 CPU 共享池。immovable:该策略会将 Pod 固定在某些 CPU 核心上,但这些核心属于共享池,其他 Pod 仍可使用。
首先需要在 Crane-Agent 启动参数中添加 --feature-gates=NodeResourceTopology=true,CraneCPUManager=true 开启拓扑感知调度特性。然后安装下面的步骤修改 K8s 集群默认的调度器。
- 备份
/etc/kubernetes/manifests/kube-scheduler.yaml
cp /etc/kubernetes/manifests/kube-scheduler.yaml /etc/kubernetes/
- 通过修改 kube-scheduler 的配置文件(
scheduler-config.yaml) 启用动态调度插件并配置插件参数:
apiVersion: kubescheduler.config.k8s.io/v1beta2
kind: KubeSchedulerConfiguration
leaderElection:
  leaderElect: true
clientConnection:
  kubeconfig: 'REPLACE_ME_WITH_KUBE_CONFIG_PATH'
profiles:
  - schedulerName: default-scheduler
    plugins:
      preFilter:
        enabled:
          - name: NodeResourceTopologyMatch
      filter:
        enabled:
          - name: NodeResourceTopologyMatch
      score:
        enabled:
          - name: NodeResourceTopologyMatch
            weight: 2
      reserve:
        enabled:
          - name: NodeResourceTopologyMatch
      preBind:
        enabled:
          - name: NodeResourceTopologyMatch
- 添加 RBAC 规则
apiVersion: rbac.authorization.k8s.io/v1
kind: ClusterRole
metadata:
  name: system:kube-scheduler:plugins
rules:
  - apiGroups:
      - topology.crane.io
    resources:
      - '*'
    verbs:
      - get
      - list
      - watch
  - apiGroups:
      - ''
    resources:
      - pods
    verbs:
      - patch
---
kind: ClusterRoleBinding
apiVersion: rbac.authorization.k8s.io/v1
metadata:
  name: system:kube-scheduler:plugins
roleRef:
  apiGroup: rbac.authorization.k8s.io
  kind: ClusterRole
  name: system:kube-scheduler:plugins
subjects:
  - kind: User
    apiGroup: rbac.authorization.k8s.io
    name: system:kube-scheduler
- 修改
kube-scheduler.yaml并用 Crane-scheduler 的镜像替换 kube-scheduler 镜像
正确安装组件后,每个节点均会生成 NodeResourceTopology 对象。
$ kubectl get nrt
NAME    CRANE CPU MANAGER POLICY   CRANE TOPOLOGY MANAGER POLICY   AGE
node1   Static                     SingleNUMANodePodLevel          35d
可以看出集群中节点 node1 已生成对应的 NRT 对象,此时 Crane 的 CPU Manager Policy 为 Static,节点默认的 Topology Manager Policy 为 SingleNUMANodePodLevel,代表节点不允许跨 NUMA 分配资源。
使用以下实例进行调度测试:
apiVersion: apps/v1
kind: Deployment
metadata:
  name: nginx-deployment
  labels:
    app: nginx
spec:
  selector:
    matchLabels:
      app: nginx
  template:
    metadata:
      annotations:
        topology.crane.io/topology-awareness: 'true' # 添加注解,表示Pod需要感知CPU拓扑,资源分配不允许跨NUMA。若不指定,则拓扑策略默认继承节点上的topology.crane.io/topology-awareness标签
        topology.crane.io/cpu-policy: 'exclusive' # 添加注解,表示Pod的CPU分配策略为exclusive策略。
      labels:
        app: nginx
    spec:
      containers:
        - image: nginx
          name: nginx
          resources:
            limits:
              cpu: '2' # 需要limits.cpu值,如果要开启绑核,则该值必须等于requests.cpu。
              memory: 2Gi
应用后可以从 annotations 中查看 Pod 的拓扑分配结果,发现 Pod 在 NUMA Node0 上被分配了 2 个 CPU 核心。
$ kubectl get pod -o custom-columns=name:metadata.name,topology-result:metadata.annotations."topology\.crane\.io/topology-result"
name                                topology-result
nginx-deployment-754d99dcdf-mtcdp   [{"name":"node0","type":"Node","resources":{"capacity":{"cpu":"2"}}}]
实现基于流量预测的弹性
Kubernetes HPA 支持了丰富的弹性扩展能力,Kubernetes 平台开发者部署服务实现自定义 Metric 的服务,Kubernetes 用户配置多项内置的资源指标或者自定义 Metric 指标实现自定义水平弹性。
EffectiveHorizontalPodAutoscaler(简称 EHPA)是 Crane 提供的弹性伸缩产品,它基于社区 HPA 做底层的弹性控制,支持更丰富的弹性触发策略(预测,观测,周期),让弹性更加高效,并保障了服务的质量。
- 提前扩容,保证服务质量:通过算法预测未来的流量洪峰提前扩容,避免扩容不及时导致的雪崩和服务稳定性故障。
- 减少无效缩容:通过预测未来可减少不必要的缩容,稳定工作负载的资源使用率,消除突刺误判。
- 支持 Cron 配置:支持 Cron-based 弹性配置,应对大促等异常流量洪峰。
- 兼容社区:使用社区 HPA 作为弹性控制的执行层,能力完全兼容社区。
Effective HPA 兼容社区的 Kubernetes HPA 的能力,提供了更智能的弹性策略,比如基于预测的弹性和基于 Cron 周期的弹性等。
基于自定义指标的容器弹性伸缩
在了解如何使用 EHPA 之前,我们有必要来详细了解下 K8s 中的 HPA 对象。通过此伸缩组件,Kubernetes 集群可以利用监控指标(CPU 使用率等)自动扩容或者缩容服务中的 Pod 数量,当业务需求增加时,HPA 将自动增加服务的 Pod 数量,提高系统稳定性,而当业务需求下降时,HPA 将自动减少服务的 Pod 数量,减少对集群资源的请求量,甚至还可以配合 Cluster Autoscaler 实现集群规模的自动伸缩,节省 IT 成本。
不过目前默认的 HPA 对象只能支持根据 CPU 和内存的阈值检测扩缩容,但也可以通过 custom metric api 来调用 Prometheus 实现自定义 metric,这样就可以实现更加灵活的监控指标实现弹性伸缩了。
默认情况下,HPA 会通过 metrics.k8s.io 这个接口服务来获取 Pod 的 CPU、内存指标,CPU 和内存这两者属于核心指标,metrics.k8s.io 服务对应的后端服务一般是 metrics-server,所以在使用 HPA 的时候需要安装该应用。
如果 HPA 要通过非 CPU、内存的其他指标来伸缩容器,我们则需要部署一套监控系统如 Prometheus,让 Prometheus 采集各种指标,但是 Prometheus 采集到的 metrics 指标并不能直接给 K8s 使用,因为两者数据格式是不兼容的,因此需要使用到另外一个组件 prometheus-adapter,该组件可以将 Prometheus 的 metrics 指标数据格式转换成 K8s API 接口能识别的格式,另外我们还需要在 K8s 注册一个服务(即 custom.metrics.k8s.io),以便 HPA 能通过 /apis/ 进行访问。
需要注意的是 Crane 提供了一个 metric-adapter 组件,该组件和 prometheus-adapter 都基于 custom-metric-apiserver 实现了 Custom Metric 和 External Metric 的 ApiService,在安装 Crane 时会将对应的 ApiService 安装为 Crane 的 metric-adapter,所以它会和 prometheus-adapter 冲突,因为 Prometheus 是当下最流行的开源监控系统,所以我们更愿意使用它来获取用户的自定义指标,那么我们就需要去安装 prometheus-adapter,但是在安装之前需要删除 Crane 提供的 ApiService。
# 查看当前集群 ApiService
$ kubectl get apiservice |grep crane-system
v1beta1.custom.metrics.k8s.io          crane-system/metric-adapter                    True                      3h51m
v1beta1.external.metrics.k8s.io        crane-system/metric-adapter                    True                      3h51m

# 删除 crane 安装的 ApiService
$ kubectl delete apiservice v1beta1.custom.metrics.k8s.io
$ kubectl delete apiservice v1beta1.external.metrics.k8s.io
然后通过 Helm Chart 来安装 Prometheus Adapter:
$ helm repo add prometheus-community https://prometheus-community.github.io/helm-charts
$ helm repo update
# 指定有 prometheus 地址
$ helm upgrade --install prometheus-adapter -n crane-system prometheus-community/prometheus-adapter --set image.repository=cnych/prometheus-adapter,prometheus.url=http://prometheus-server.crane-system.svc,prometheus.port=8080
当 prometheus-adapter 安装成功后我们再将 ApiService 改回 Crane 的 metric-adapter,应用下面的资源清单即可:
apiVersion: apiregistration.k8s.io/v1
kind: APIService
metadata:
  name: v1beta1.custom.metrics.k8s.io
spec:
  service:
    name: metric-adapter
    namespace: crane-system
  group: custom.metrics.k8s.io
  version: v1beta1
  insecureSkipTLSVerify: true
  groupPriorityMinimum: 100
  versionPriority: 100
---
apiVersion: apiregistration.k8s.io/v1
kind: APIService
metadata:
  name: v1beta1.external.metrics.k8s.io
spec:
  service:
    name: metric-adapter
    namespace: crane-system
  group: external.metrics.k8s.io
  version: v1beta1
  insecureSkipTLSVerify: true
  groupPriorityMinimum: 100
  versionPriority: 100
应用了上面的对象后,ApiService 改回了 Crane 的 metric-adapter,那么就不能使用 prometheus-adapter 的自定义 Metrics 功能,我们可以通过 Crane 的 metric-adapter 提供的 RemoteAdapter 功能将请求转发给 prometheus-adapter。
修改 metric-adapter 的配置,将 prometheus-adapter 的 Service 配置成 Crane Metric Adapter 的 RemoteAdapter。
$ kubectl edit deploy metric-adapter -n crane-system
apiVersion: apps/v1
kind: Deployment
metadata:
  name: metric-adapter
  namespace: crane-system
spec:
  template:
    spec:
      containers:
      - args:
        # 添加外部 Adapter 配置
        - --remote-adapter=true
        - --remote-adapter-service-namespace=crane-system
        - --remote-adapter-service-name=prometheus-adapter
        - --remote-adapter-service-port=443
# ......
这是因为 Kubernetes 限制一个 ApiService 只能配置一个后端服务,为了在一个集群内使用 Crane 提供的 Metric 和 prometheus-adapter 提供的 Metric,Crane 支持了 RemoteAdapter 来解决该问题:
- Crane Metric-Adapter 支持配置一个 Kubernetes Service 作为一个远程 Adapter
- Crane Metric-Adapter 处理请求时会先检查是否是 Crane 提供的 Local Metric,如果不是,则转发给远程 Adapter
下面我们来部署一个示例应用,用来测试自定义指标的容器弹性伸缩。如下所示的应用暴露了 Metric 展示每秒收到的 http 请求数量。
# sample-app.yaml
apiVersion: apps/v1
kind: Deployment
metadata:
  name: sample-app
  labels:
    app: sample-app
spec:
  selector:
    matchLabels:
      app: sample-app
  template:
    metadata:
      labels:
        app: sample-app
    spec:
      containers:
        - image: luxas/autoscale-demo:v0.1.2
          name: metrics-provider
          resources:
            limits:
              cpu: 500m
            requests:
              cpu: 200m
          ports:
            - containerPort: 8080
---
apiVersion: v1
kind: Service
metadata:
  labels:
    app: sample-app
  name: sample-app
spec:
  ports:
    - name: http
      port: 80
      targetPort: 8080
  selector:
    app: sample-app
  type: NodePort
当应用部署完成后,我们可以通过命令检查 http_requests_total 指标数据:
$ curl http://$(kubectl get service sample-app -o jsonpath='{ .spec.clusterIP }')/metrics
# HELP http_requests_total The amount of requests served by the server in total
# TYPE http_requests_total counter
http_requests_total 1
然后我们需要在 Prometheus 中配置抓取 sample-app 的指标,我们这里使用如下所示命令添加抓取配置:
$ kubectl edit cm -n crane-system prometheus-server
# 添加抓取 sample-app 配置
- job_name: sample-app
  kubernetes_sd_configs:
  - role: pod
  relabel_configs:
  - action: keep
    regex: default;sample-app-(.+)
    source_labels:
    - __meta_kubernetes_namespace
    - __meta_kubernetes_pod_name
  - action: labelmap
    regex: __meta_kubernetes_pod_label_(.+)
  - action: replace
    source_labels:
    - __meta_kubernetes_namespace
    target_label: namespace
  - source_labels: [__meta_kubernetes_pod_name]
    action: replace
    target_label: pod
配置生效后我们可以在 Prometheus Dashboard 中查询对应的指标:
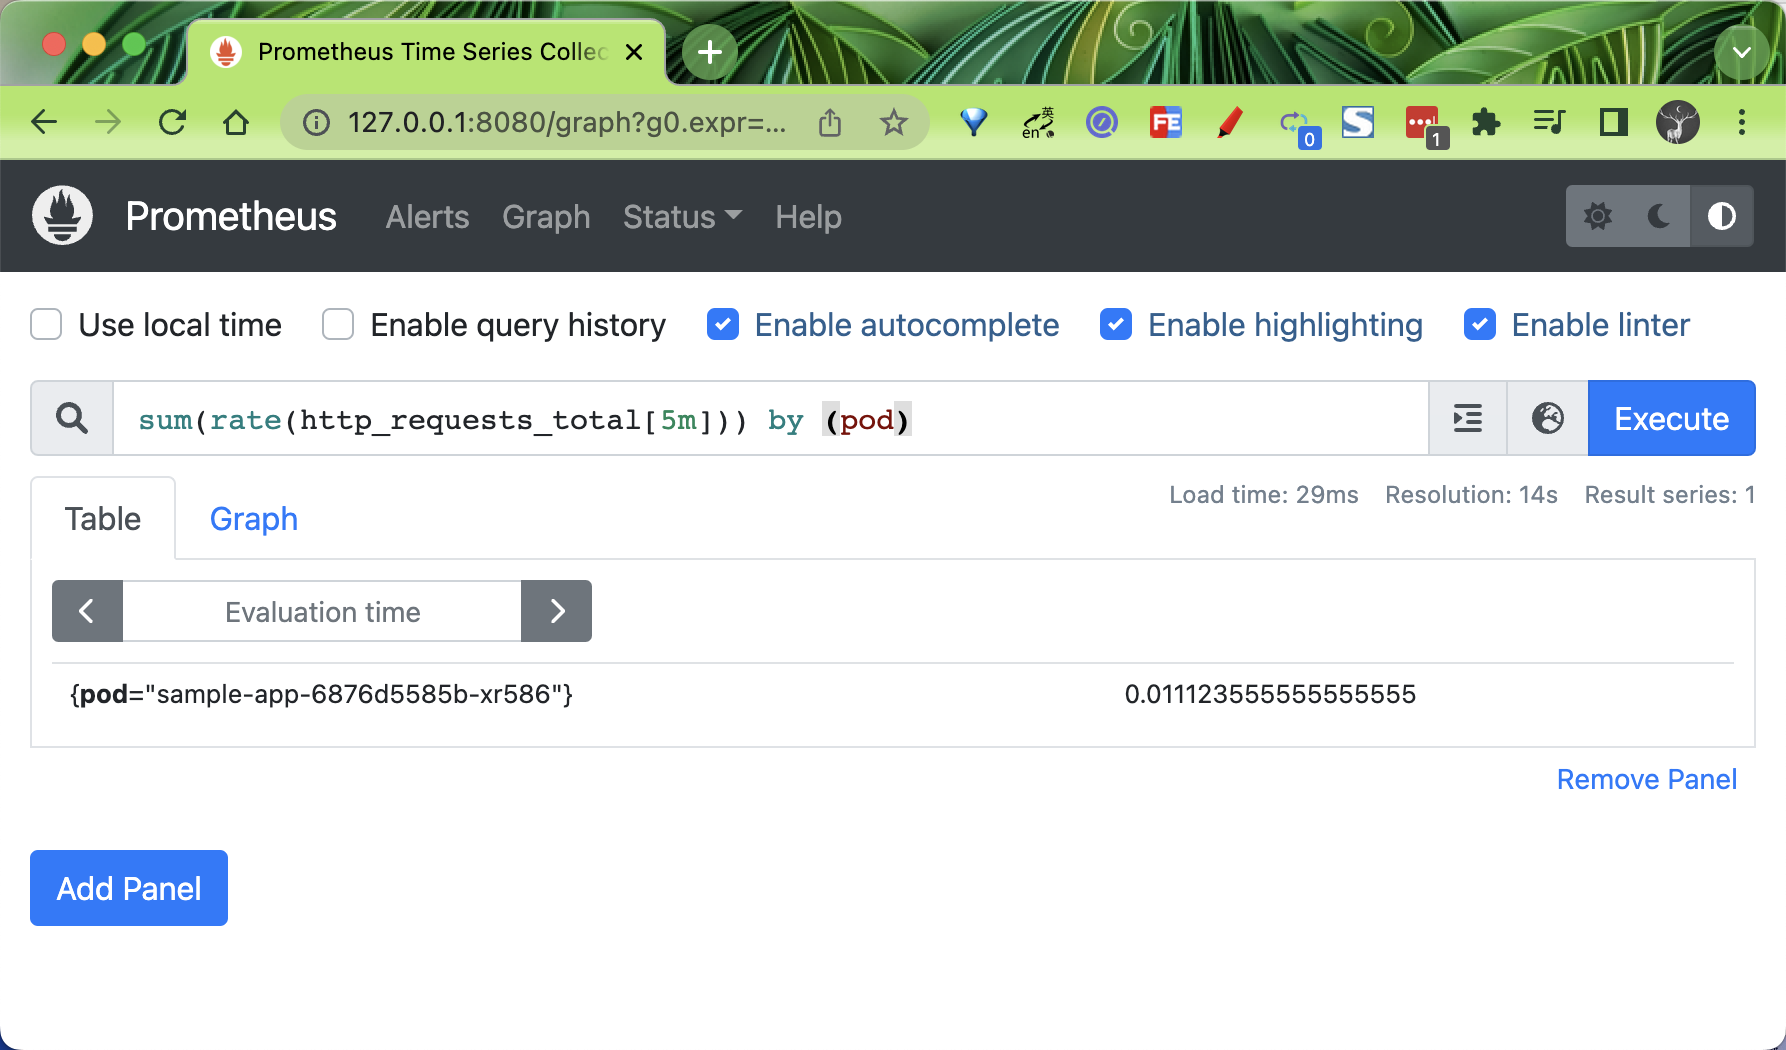
为了让 HPA 能够用到 Prometheus 采集到的指标,prometheus-adapter 通过使用 promql 语句来获取指标,然后修改数据格式,并把重新组装的指标和值通过自己的接口暴露。而 HPA 会通过 /apis/custom.metrics.k8s.io/ 代理到 prometheus-adapter 的 service 上来获取这些指标。
如果把 Prometheus 的所有指标到获取一遍并重新组装,那 adapter 的效率必然十分低下,因此 adapter 将需要读取的指标设计成可配置,让用户通过 ConfigMap 来决定读取 Prometheus 的哪些监控指标。
我们这里使用 Helm Chart 方式安装的 prometheus-adapter,其默认的 Rule 配置如下所示:
$ kubectl get cm -n crane-system prometheus-adapter -oyaml
apiVersion: v1
data:
  config.yaml: |
    rules:
    - seriesQuery: '{__name__=~"^container_.*",container!="POD",namespace!="",pod!=""}'
      seriesFilters: []
      resources:
        overrides:
          namespace:
            resource: namespace
          pod:
            resource: pod
      name:
        matches: ^container_(.*)_seconds_total$
        as: ""
      metricsQuery: sum(rate(<<.Series>>{<<.LabelMatchers>>,container!="POD"}[5m]))
        by (<<.GroupBy>>)
    - seriesQuery: '{__name__=~"^container_.*",container!="POD",namespace!="",pod!=""}'
      seriesFilters:
      - isNot: ^container_.*_seconds_total$
      resources:
        overrides:
          namespace:
            resource: namespace
          pod:
            resource: pod
      name:
        matches: ^container_(.*)_total$
        as: ""
      metricsQuery: sum(rate(<<.Series>>{<<.LabelMatchers>>,container!="POD"}[5m]))
        by (<<.GroupBy>>)
    - seriesQuery: '{__name__=~"^container_.*",container!="POD",namespace!="",pod!=""}'
      seriesFilters:
      - isNot: ^container_.*_total$
      resources:
        overrides:
          namespace:
            resource: namespace
          pod:
            resource: pod
      name:
        matches: ^container_(.*)$
        as: ""
      metricsQuery: sum(<<.Series>>{<<.LabelMatchers>>,container!="POD"}) by (<<.GroupBy>>)
    - seriesQuery: '{namespace!="",__name__!~"^container_.*"}'
      seriesFilters:
      - isNot: .*_total$
      resources:
        template: <<.Resource>>
      name:
        matches: ""
        as: ""
      metricsQuery: sum(<<.Series>>{<<.LabelMatchers>>}) by (<<.GroupBy>>)
    - seriesQuery: '{namespace!="",__name__!~"^container_.*"}'
      seriesFilters:
      - isNot: .*_seconds_total
      resources:
        template: <<.Resource>>
      name:
        matches: ^(.*)_total$
        as: ""
      metricsQuery: sum(rate(<<.Series>>{<<.LabelMatchers>>}[5m])) by (<<.GroupBy>>)
    - seriesQuery: '{namespace!="",__name__!~"^container_.*"}'
      seriesFilters: []
      resources:
        template: <<.Resource>>
      name:
        matches: ^(.*)_seconds_total$
        as: ""
      metricsQuery: sum(rate(<<.Series>>{<<.LabelMatchers>>}[5m])) by (<<.GroupBy>>)
kind: ConfigMap
metadata:
  name: prometheus-adapter
  namespace: crane-system
Prometheus adapter 的配置文件格式如上所示,它分为两个部分,第一个是 rules,用于 custom metrics,另一个是 resourceRules,用于 metrics,如果你只用 Prometheus adapter 做 HPA,那么 resourceRules 就可以省略。
我们可以看到 rules 规则下面有很多的查询语句,这些查询语句的作用就是尽可能多的获取指标,从而让这些指标都可以用于 HPA。也就是说通过 prometheus-adapter 可以将 Prometheus 中的任何一个指标都用于 HPA,但是前提是你得通过查询语句将它拿到(包括指标名称和其对应的值)。也就是说,如果你只需要使用一个指标做 HPA,那么你完全就可以只写一条查询,而不像上面使用了好多个查询。
整体上每个规则大致可以分为 4 个部分:
Discovery:它指定 Adapter 应该如何找到该规则的所有 Prometheus 指标Association:指定 Adapter 应该如何确定和特定的指标关联的 Kubernetes 资源Naming:指定 Adapter 应该如何在自定义指标 API 中暴露指标Querying:指定如何将对一个获多个 Kubernetes 对象上的特定指标的请求转换为对 Prometheus 的查询
Discovery
指定待转换的 Prometheus 指标,你可以通过 seriesFilters 精确过滤指标,seriesQuery 可以根据标签进行查找(如下),也可以直接指定 metric name 查找。
seriesQuery: http_requests_total{namespace!="",pod!=""}
seriesFilters:
  - isNot: '^container_.*_seconds_total'
其中 seriesFilters 为非必填项,用来过滤指标:
is:<regex>:匹配包含该正则表达式的指标。isNot:<regex>:匹配不包含该正则表达式的指标。
Association
设置 Prometheus 指标标签与 Kubernetes 中的资源映射关系,Kubernetes Resources 可以通过 kubectl api-resources 命令查看。overrides 会将 Prometheus metric label 与一个 Kubernetes resource(下例为 deployment)关联。需要注意的是该 label 必须是一个真实的 Kubernetes resource,如 metric 的 pod 标签可以映射为 Kubernetes 的 pod resource,但不能将 container_image 映射为 Kubernetes 的 pod resource,映射错误会导致无法通过 custom metrics API 获取正确的值,这也表示 metric 中必须存在一个真实的 resource 名称,将其映射为 Kubernetes resource。
# microservice 标签对应于 apps.deployment 资源
resources:
  overrides:
    # 此处 resource 为 Kubernetes 的 API Resource,可通过 kubectl api-resources -o wide 查看。
    microservice: { group: 'apps', resource: 'deployment' }
    # 此处 key(microservice)对应 Prometheus 数据中的 LabelName,请确认 Prometheus 指标数据中有此 LabelName。
Naming
将 Prometheus 指标名称转换为自定义指标 API 中的指标的过程,它由 name 字段控制。命名通过指定一种模式来控制的,以从 Prometheus 名称中提取 API 名称,并可能对该提取的值进行转换。
模式在 matches 字段中指定,并且只是一个正则表达式。如果未指定,则默认为 .*。转换由 as 字段指定,可以使用 matches 字段中定义的任何捕获组,如果 matches 字段不包含捕获组,则 as 字段默认为 $0,如果它包含单个捕获组,则 as 字段默认为 $1,as 为空就是使用默认值的意思。例如:
# 将任意名称 `<name>_total` 转换为 `<name>_per_second`
# e.g. http_requests_total 变成 http_requests_per_second
name:
  matches: '^(.*)_total$'
  as: '${1}_per_second'
Querying
处理调用 custom metrics API 获取到的 metrics 的 value,该值最终提供给 HPA 进行扩缩容,它由 metricsQuery 字段控制。metricsQuery 字段使用 Go template 将 URL 请求转变为 Prometheus 的请求,它会提取 custom metrics API 请求中的字段,并将其划分为 metric name、group-resource 以及 group-resource 中的一个或多个 objects,对应如下字段:
Series: metric 名称LabelMatchers: 以逗号分割的 objects,当前表示特定 group-resource 加上命名空间的 label(如果该 group-resource 是 namespaced 的)GroupBy:以逗号分割的 label 的集合,当前表示LabelMatchers中的 group-resource label
假设有一个如下所示的 http_requests_per_second 指标:
http_requests_per_second{pod="pod1",service="nginx1",namespace="somens"}
http_requests_per_second{pod="pod2",service="nginx2",namespace="somens"}
当调用 kubectl get --raw "/apis/{APIService-name}/v1beta1/namespaces/somens/pods/*/http_request_per_second" 时,metricsQuery 字段的模板的实际内容如下:
- Series: "http_requests_total"
- LabelMatchers: "pod=~\"pod1|pod2", namespace="somens"
- GroupBy:pod
我们这里使用的 sample-app 应用的指标名叫 http_requests_total,通过上面的规则后会将 http_requests_total 转换成 Pods 类型的 Custom Metric,可以获得类似于 pods/http_requests 这样的数据。
执行以下命令,通过 Custom Metrics 指标查询方式,查看 HPA 可用指标详情。
$ kubectl get --raw "/apis/custom.metrics.k8s.io/v1beta1/namespaces/default/pods/*/http_requests" | jq .
{
  "kind": "MetricValueList",
  "apiVersion": "custom.metrics.k8s.io/v1beta1",
  "metadata": {
    "selfLink": "/apis/custom.metrics.k8s.io/v1beta1/namespaces/default/pods/%2A/http_requests"
  },
  "items": [
    {
      "describedObject": {
        "kind": "Pod",
        "namespace": "default",
        "name": "sample-app-6876d5585b-wv8fl",
        "apiVersion": "/v1"
      },
      "metricName": "http_requests",
      "timestamp": "2022-10-27T11:19:05Z",
      "value": "18m",
      "selector": null
    }
  ]
}
然后我们可以创建一个如下所示的 HPA 对象:
# sample-app-hpa.yaml
apiVersion: autoscaling/v2beta1
kind: HorizontalPodAutoscaler
metadata:
  name: sample-app-hpa
spec:
  # HPA的伸缩对象描述,HPA 会动态修改该对象的 Pod 数量。
  scaleTargetRef:
    apiVersion: apps/v1
    kind: Deployment
    name: sample-app
  # HPA 的最小 Pod 数量和最大 Pod 数量。
  minReplicas: 1
  maxReplicas: 10
  # 监控的指标数组,支持多种类型的指标共存。
  metrics:
    - type: Pods
      pods:
        #使用指标:pods/http_requests。
        metricName: http_requests
        # AverageValue 类型的目标值,Pods 指标类型下只支持 AverageValue 类型的目标值。
        targetAverageValue: 500m # 当出现了小数点,K8s 又需要高精度时,会使用单位 m 或k。例如1001m=1.001,1k=1000。
直接应用该资源对象即可:
$ kubectl apply -f sample-app-hpa.yaml
horizontalpodautoscaler.autoscaling/sample-app-hpa created
$ kubectl get hpa
NAME             REFERENCE               TARGETS   MINPODS   MAXPODS   REPLICAS   AGE
sample-app-hpa   Deployment/sample-app   16m/50m   1         10        1          25s
然后针对 sample-app 服务做压力测试:
$ kubectl get svc sample-app
NAME         TYPE       CLUSTER-IP       EXTERNAL-IP   PORT(S)        AGE
sample-app   NodePort   10.104.163.144   <none>        80:31941/TCP   3h59m
$ ab -c 50 -n 2000 http://192.168.0.106:31941/
然后查看 HPA 的状态。
$ kubectl get hpa
NAME             REFERENCE               TARGETS     MINPODS   MAXPODS   REPLICAS   AGE
sample-app-hpa   Deployment/sample-app   8001m/50m   1         10        4          7m58s
$ kubectl describe hpa sample-app-hpa
Name:                       sample-app-hpa
Namespace:                  default
Labels:                     <none>
Annotations:                <none>
CreationTimestamp:          Thu, 27 Oct 2022 19:24:16 +0800
Reference:                  Deployment/sample-app
Metrics:                    ( current / target )
  "http_requests" on pods:  2093m / 50m
Min replicas:               1
Max replicas:               10
Deployment pods:            10 current / 10 desired
Conditions:
  Type            Status  Reason            Message
  ----            ------  ------            -------
  AbleToScale     True    ReadyForNewScale  recommended size matches current size
  ScalingActive   True    ValidMetricFound  the HPA was able to successfully calculate a replica count from pods metric http_requests
  ScalingLimited  True    TooManyReplicas   the desired replica count is more than the maximum replica count
Events:
  Type    Reason             Age   From                       Message
  ----    ------             ----  ----                       -------
  Normal  SuccessfulRescale  105s  horizontal-pod-autoscaler  New size: 4; reason: pods metric http_requests above target
  Normal  SuccessfulRescale  90s   horizontal-pod-autoscaler  New size: 8; reason: pods metric http_requests above target
  Normal  SuccessfulRescale  75s   horizontal-pod-autoscaler  New size: 10; reason: pods metric http_requests above target
可以看到基于我们自定义的指标实现容器的弹性已经成功了。
基于流量预测的容器弹性伸缩
接下来我们再来测试下基于流量预测的容器弹性伸缩,这就需要用到 Crane 的 EHPA 对象了。我们可以使用上面的 pods/http_requests 自定义指标来实现弹性功能。
许多业务在时间序列上天然存在周期性的,尤其是对于那些直接或间接为“人”服务的业务。这种周期性是由人们日常活动的规律性决定的。例如,人们习惯于中午和晚上点外卖;早晚总有交通高峰;即使是搜索等模式不那么明显的服务,夜间的请求量也远低于白天时间。对于这类业务相关的应用来说,从过去几天的历史数据中推断出次日的指标,或者从上周一的数据中推断出下周一的访问量是很自然的想法。通过预测未来 24 小时内的指标或流量模式,我们可以更好地管理我们的应用程序实例,稳定我们的系统,同时降低成本。EHPA 对象可以使用 DSP 算法来预测应用未来的时间序列数据,DSP 是一种预测时间序列的算法,它基于 FFT(快速傅里叶变换),擅长预测一些具有季节性和周期的时间序列。
接下来我们创建一个如下所示的 EHPA 资源对象,并开启预测功能:
# sample-app-ehpa.yaml
apiVersion: autoscaling.crane.io/v1alpha1
kind: EffectiveHorizontalPodAutoscaler
metadata:
  name: sample-app-ehpa
  annotations:
    # metric-query.autoscaling.crane.io 是固定的前缀
    # 后面是 prefix.Metrics,前缀支持 pods、resource、external 类型
    metric-query.autoscaling.crane.io/pods.http_requests: 'sum(rate(http_requests_total[5m])) by (pod)'
spec:
  # ScaleTargetRef 是对需要缩放的工作负载的引用
  scaleTargetRef:
    apiVersion: apps/v1
    kind: Deployment
    name: sample-app
  # minReplicas 是可以缩小到的缩放目标的最小副本数
  minReplicas: 1
  # maxReplicas 是可以扩大到的缩放目标的最大副本数
  maxReplicas: 10
  # scaleStrategy 表示缩放目标的策略,值可以是 Auto 或 Manual
  scaleStrategy: Auto
  # metrics 包含用于计算所需副本数的规范。
  metrics:
    # 在使用预测算法预测时,你可能会担心预测数据不准带来一定的风险,EHPA 在计算副本数时,不仅会按预测数据计算,同时也会考虑实际监控数据来兜底,提升弹性的安全性,所以可以定义下面的 Resource 监控数据来兜底
    # - type: Resource
    #   resource:
    #     name: cpu
    #     target:
    #       type: Utilization
    #       averageUtilization: 50
    - type: Pods
      pods:
        metric:
          name: http_requests # 和上面注解中的 metric-query.autoscaling.crane.io/pods.(.*) 必须一致
        target:
          type: AverageValue
          averageValue: 500m # 当出现了小数点,K8s 又需要高精度时,会使用单位 m 或k。例如1001m=1.001,1k=1000。
  # prediction 定义了预测资源的配置,如果未指定,则默认不启用预测功能
  prediction:
    predictionWindowSeconds: 3600 # PredictionWindowSeconds 是预测未来指标的时间窗口
    predictionAlgorithm:
      algorithmType: dsp # 指定dsp为预测算法
      dsp:
        sampleInterval: '60s' # 监控数据的采样间隔为1分钟
        historyLength: '7d' # 拉取过去7天的监控指标作为预测的依据
在上面的资源对象中添加了一个 metric-query.autoscaling.crane.io/pods.http_requests: "sum(rate(http_requests_total[5m])) by (pod)" 的注解,这样就可以开启自定义指标的预测功能了,该注解的前缀 metric-query.autoscaling.crane.io/ 是固定不变的,后面的 pods.http_requests 需要根据我们指定的指标类型而定,注意的是我们这里是指定 Pods 类型的指标,所以这里的注解 key 后面是 pods.http_requests,后面的 http_requests 就是配置的指标名称。
相应的在规范中定义了 spec.prediction 属性,用来指定预测资源的配置,其中的 predictionWindowSeconds 属性用来指定预测未来指标的时间窗口,predictionAlgorithm 属性用来指定预测的算法,比如我们这里配置的 algorithmType: dsp 表示使用 DSP(Digital Signal Processing)算法进行预测,该算法使用在数字信号处理领域中常用的的离散傅里叶变换、自相关函数等手段来识别、预测周期性的时间序列,关于该算法的实现原理可以查看官方文档 https://gocrane.io/zh-cn/docs/tutorials/timeseriees-forecasting-by-dsp/ 的相关介绍,或者查看源码以了解背后原理,相关代码位于 pkg/prediction/dsp 目录下。此外在 prediction.predictionAlgorithm.dsp 下面还可以配置 dsp 算法的相关参数,比如我们这里配置的 sampleInterval: "60s" 表示监控数据的采样间隔为 1 分钟,historyLength: "7d" 表示拉取过去 7 天的监控指标作为预测的依据,此外还可以配置预测方式等。
然后核心的配置就是 spec.metrics 了,用来指定计算所需副本数的规范,我们这里指定了基于 Pods 指标的计算方式。
- type: Pods
  pods:
    metric:
      name: http_requests
    target:
      type: AverageValue
      averageValue: 500m
上面的配置表示当 pods/http_requests 的自定义指标平均值达到 500m 后就可以触发 HPA 缩放,这里有一个点需要注意自定义指标的 pods.metric.name 的值必须和 annotations 注解 metric-query.autoscaling.crane.io/<metric name> 指标名保持一致。
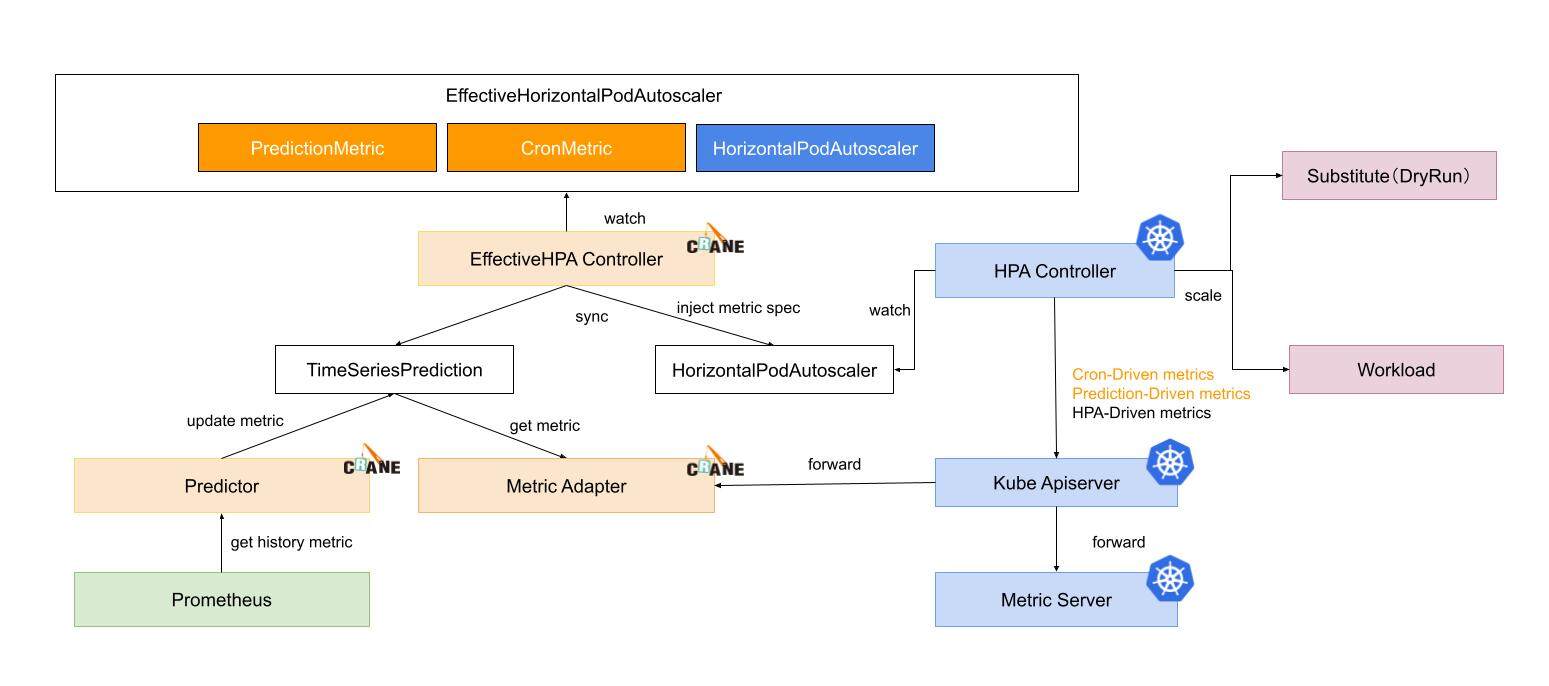
EHPA 对象水平弹性的执行流程如下所示:
EffectiveHPAController创建HorizontalPodAutoscaler和TimeSeriesPrediction对象PredictionCore从 Prometheus 获取历史 metric 通过预测算法计算,将结果记录到TimeSeriesPredictionHPAController通过 metric client 从 KubeApiServer 读取 metric 数据KubeApiServer将请求路由到 Crane 的 Metric-Adapter。HPAController计算所有的 Metric 返回的结果得到最终的弹性副本推荐。HPAController调用 scale API 对目标应用扩/缩容。
整体流程如下所示:
直接应用上面的 EPHA 对象即可:
$ kubectl apply -f sample-app-ehpa.yaml
effectivehorizontalpodautoscaler.autoscaling.crane.io/sample-app-ehpa created
$ kubectl get ehpa
NAME              STRATEGY   MINPODS   MAXPODS   SPECIFICPODS   REPLICAS   AGE
sample-app-ehpa   Auto       1         10                       1          17s
由于我们开启了自动预测功能,所以 EPHA 对象创建后会创建一个对应的 TimeSeriesPrediction 对象:
$ kubectl get tsp
NAME                   TARGETREFNAME   TARGETREFKIND   PREDICTIONWINDOWSECONDS   AGE
ehpa-sample-app-ehpa   sample-app      Deployment      3600                      3m50s
$ kubectl get tsp ehpa-sample-app-ehpa -oyaml
apiVersion: prediction.crane.io/v1alpha1
kind: TimeSeriesPrediction
metadata:
  name: ehpa-sample-app-ehpa
  namespace: default
spec:
  predictionMetrics:
  - algorithm:
      algorithmType: dsp
      dsp:
        estimators: {}
        historyLength: 7d
        sampleInterval: 60s
    expressionQuery:
      expression: sum(rate(http_requests_total[5m])) by (pod)
    resourceIdentifier: pods.http_requests
    type: ExpressionQuery
  predictionWindowSeconds: 3600
  targetRef:
    apiVersion: apps/v1
    kind: Deployment
    name: sample-app
    namespace: default
status:
  conditions:
  - lastTransitionTime: "2022-10-29T06:50:46Z"
    message: not all metric predicted
    reason: PredictPartial
    status: "False"
    type: Ready
  predictionMetrics:
  - ready: false
    resourceIdentifier: pods.http_requests
在 status 中可以看到包含 not all metric predicted 这样的信息,这是因为应用运行时间较短,可能会出现无法预测的情况。同样也会自动创建一个对应的 HPA 对象:
$ kubectl get hpa
NAME                   REFERENCE               TARGETS    MINPODS   MAXPODS   REPLICAS   AGE
ehpa-sample-app-ehpa   Deployment/sample-app   16m/500m   1         10        1          69m
然后我们可以重新使用 ab 命令对 sample-app 做一次压力测试,正常也可以触发该应用的弹性扩容。
$ kubectl get hpa
NAME                   REFERENCE               TARGETS      MINPODS   MAXPODS   REPLICAS   AGE
ehpa-sample-app-ehpa   Deployment/sample-app   7291m/500m   1         10        10         71m
$ kubectl describe hpa ehpa-sample-app-ehpa
Name:                       ehpa-sample-app-ehpa
Namespace:                  default
Labels:                     app.kubernetes.io/managed-by=effective-hpa-controller
                            app.kubernetes.io/name=ehpa-sample-app-ehpa
                            app.kubernetes.io/part-of=sample-app-ehpa
                            autoscaling.crane.io/effective-hpa-uid=8fad0b0b-8a53-433e-b483-9f2ff61aaa58
Annotations:                <none>
CreationTimestamp:          Thu, 27 Oct 2022 21:01:13 +0800
Reference:                  Deployment/sample-app
Metrics:                    ( current / target )
  "http_requests" on pods:  8350m / 500m
Min replicas:               1
Max replicas:               10
Deployment pods:            10 current / 10 desired
Conditions:
  Type            Status  Reason            Message
  ----            ------  ------            -------
  AbleToScale     True    ReadyForNewScale  recommended size matches current size
  ScalingActive   True    ValidMetricFound  the HPA was able to successfully calculate a replica count from pods metric http_requests
  ScalingLimited  True    TooManyReplicas   the desired replica count is more than the maximum replica count
Events:
  Type    Reason             Age   From                       Message
  ----    ------             ----  ----                       -------
  Normal  SuccessfulRescale  57s   horizontal-pod-autoscaler  New size: 4; reason: pods metric http_requests above target
  Normal  SuccessfulRescale  42s   horizontal-pod-autoscaler  New size: 8; reason: pods metric http_requests above target
  Normal  SuccessfulRescale  27s   horizontal-pod-autoscaler  New size: 10; reason: pods metric http_requests above target
我们可以使用如下所示命令来查看 EHPA 自动生成的 HPA 对象的资源清单:
$ kubectl get hpa.v2beta2.autoscaling ehpa-sample-app-ehpa -oyaml
apiVersion: autoscaling/v2beta2
kind: HorizontalPodAutoscaler
metadata:
  name: ehpa-sample-app-ehpa
  namespace: default
spec:
  maxReplicas: 10
  metrics:
  - pods:
      metric:
        name: http_requests
      target:
        averageValue: 500m
        type: AverageValue
    type: Pods
  minReplicas: 1
  scaleTargetRef:
    apiVersion: apps/v1
    kind: Deployment
    name: sample-app
status:
  conditions:
  - lastTransitionTime: "2022-10-27T13:01:28Z"
    message: recent recommendations were higher than current one, applying the highest
      recent recommendation
    reason: ScaleDownStabilized
    status: "True"
    type: AbleToScale
  - lastTransitionTime: "2022-10-27T13:01:28Z"
    message: the HPA was able to successfully calculate a replica count from pods
      metric http_requests
    reason: ValidMetricFound
    status: "True"
    type: ScalingActive
  - lastTransitionTime: "2022-10-27T14:11:24Z"
    message: the desired replica count is more than the maximum replica count
    reason: TooManyReplicas
    status: "True"
    type: ScalingLimited
  currentMetrics:
  - pods:
      current:
        averageValue: 15m
      metric:
        name: http_requests
    type: Pods
  currentReplicas: 10
  desiredReplicas: 10
  lastScaleTime: "2022-10-27T14:11:54Z"
可以观测到已经创建出基于自定义指标预测的 Metric: http_requests,由于生产环境的复杂性,基于多指标的弹性(CPU/Memory/自定义指标)往往是生产应用的常见选择,因此 Effective HPA 通过预测算法覆盖了多指标的弹性,达到了帮助更多业务在生产环境落地水平弹性的成效。
除此之外 EHPA 对象还支持基于 cron 的自动缩放,除了基于监控指标,有时节假日和工作日的工作负载流量存在差异,简单的预测算法可能效果不佳。然后可以通过设置周末 cron 来支持更大数量的副本来弥补预测的不足。对于一些非 web 流量的应用,比如一些应用不需要在周末使用,可以把工作负载的副本数减少到 1,也可以配置 cron 来降低你的服务成本。
QOS 增强与混部
除了上面介绍的主要功能之外,crane 还具有很多 QOS 增强功能,QOS 相关能力保证了运行在 Kubernetes 上的 Pod 的稳定性。
干扰检测和主动回避
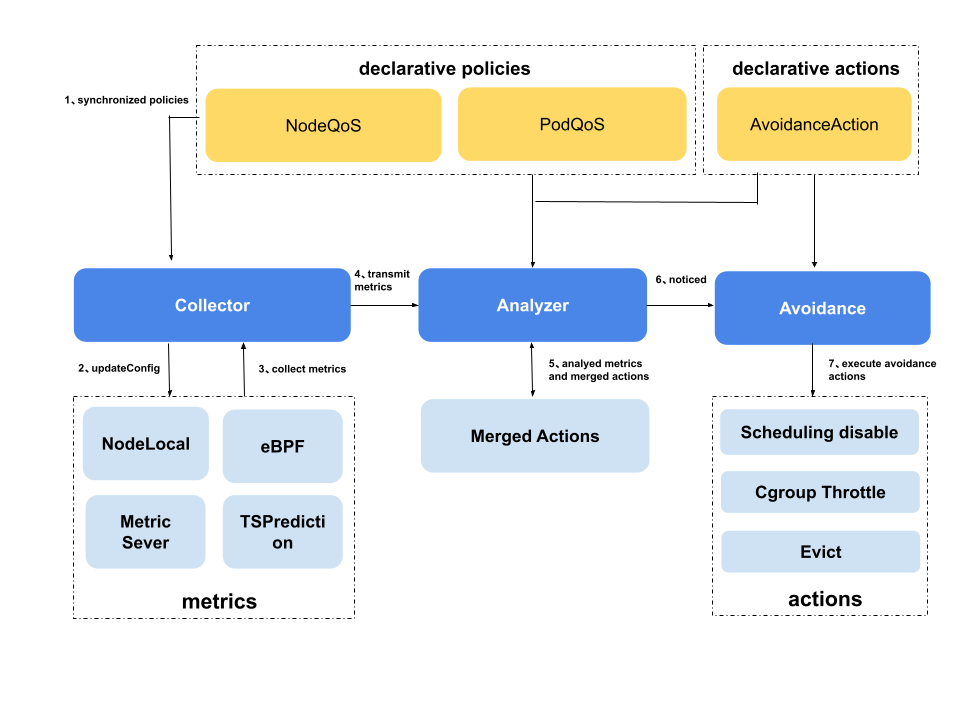
干扰检测和主动回避功能主要涉及到以下几个 CRD 对象:
AvoidanceAction:定义了检测到干扰后需要执行的操作,包含了Disable Scheduling、throttle、eviction等操作,并且定义了其相关的一些参数。NodeQOS:定义了指标采集方式和参数,水位线指标相关参数,以及指标异常时关联的回避操作,同时通过 label selector 将上面的内容关联到指定的节点。PodQOS:定义了指定 pod 可以被执行的AvoidanceAction,通常和NodeQOS搭配起来,从节点和 pod 的维度共同限制执行动作的范围,PodQOS支持的 seletor 包含 label selector、还支持筛选特定 QOSClass(“BestEffort”、“Guaranteed"等)、特定 Priority、特定 Namespace 的 pod,并且之间采用与的方式关联。
Disable Scheduling
定义如下所示几个 AvoidanceAction、PodQOS 和 NodeQOS 资源对象。当节点 CPU 使用率触发回避阈值时,将该节点设置为禁用调度。
apiVersion: ensurance.crane.io/v1alpha1
kind: AvoidanceAction
metadata:
  labels:
    app: system
  name: disablescheduling
spec:
  description: disable schedule new pods to the node
  coolDownSeconds: 300 # 节点从禁止调度状态到正常状态的最小等待时间
---
apiVersion: ensurance.crane.io/v1alpha1
kind: NodeQOS
metadata:
  name: 'watermark1'
  labels:
    app: 'system'
spec:
  nodeQualityProbe:
    timeoutSeconds: 10
    nodeLocalGet:
      localCacheTTLSeconds: 60
  rules:
    - name: 'cpu-usage'
      avoidanceThreshold: 2 # 当达到阈值并持续多次,那么我们认为规则被触发
      restoreThreshold: 2 # 当阈值未达到并继续多次, 那么我们认为规则已恢复
      actionName: 'disablescheduling' # 关联到 AvoidanceAction 名称
      strategy: 'None' # 动作的策略,你可以将其设置为“Preview”以不实际执行
      metricRule:
        name: 'cpu_total_usage' # 指标名称
        value: 4000 # 指标的阈值
---
apiVersion: ensurance.crane.io/v1alpha1
kind: PodQOS
metadata:
  name: all-elastic-pods
spec:
  allowedActions: # 被该PodQOS关联的pod允许被执行的action为eviction
    - eviction
  labelSelector: # 通过label selector关联具有preemptible_job: “true"的pod
    matchLabels:
      preemptible_job: 'true'
Throttle
定义 AvoidanceAction 和 NodeQOS。当节点 CPU 使用率触发回避阈值时,将执行节点的 Throttle Action。示例 YAML 如下所示:
apiVersion: ensurance.crane.io/v1alpha1
kind: AvoidanceAction
metadata:
  name: throttle
  labels:
    app: system
spec:
  coolDownSeconds: 300
  throttle:
    cpuThrottle:
      minCPURatio: 10 # CPU 配额的最小比例,如果 pod 被限制低于这个比例,就会被设置为这个
      stepCPURatio: 10 # 该配置设置给Throttle Action。它将在每个触发的回避动作中减少这个 CPU 配额占比。它会在每个恢复动作中增加这个 CPU 配额占比
  description: 'throttle low priority pods'
apiVersion: ensurance.crane.io/v1alpha1
kind: NodeQOS
metadata:
  name: 'watermark2'
  labels:
    app: 'system'
spec:
  nodeQualityProbe:
    timeoutSeconds: 10
    nodeLocalGet:
      localCacheTTLSeconds: 60
  rules:
    - name: 'cpu-usage'
      avoidanceThreshold: 2
      restoredThreshold: 2
      actionName: 'throttle'
      strategy: 'None'
      metricRule:
        name: 'cpu_total_usage'
        value: 6000
apiVersion: ensurance.crane.io/v1alpha1
kind: PodQOS
metadata:
  name: all-be-pods
spec:
  allowedActions:
    - throttle
  scopeSelector:
    matchExpressions:
      - operator: In
        scopeName: QOSClass
        values:
          - BestEffort
Eviction
下面的 YAML 是另一种情况,当节点 CPU 使用率触发阈值时,节点上的低优先级 pod 将被驱逐。
apiVersion: ensurance.crane.io/v1alpha1
kind: AvoidanceAction
metadata:
  name: eviction
  labels:
    app: system
spec:
  coolDownSeconds: 300
  eviction:
    terminationGracePeriodSeconds: 30 # pod 需要优雅终止的持续时间(以秒为单位)
  description: 'evict low priority pods'
apiVersion: ensurance.crane.io/v1alpha1
kind: NodeQOS
metadata:
  name: 'watermark3'
  labels:
    app: 'system'
spec:
  nodeQualityProbe:
    timeoutSeconds: 10
    nodeLocalGet:
      localCacheTTLSeconds: 60
  rules:
    - name: 'cpu-usage'
      avoidanceThreshold: 2
      restoreThreshold: 2
      actionName: 'eviction'
      strategy: 'Preview' # 回避动作策略。当设置为Preview时,将不会被实际执行
      metricRule:
        name: 'cpu_total_usage'
        value: 6000
支持的水位线指标
| Name | Description |
|---|---|
| cpu_total_usage | node cpu usage |
| cpu_total_utilization | node cpu utilization percent |
| memory_total_usage | node mem usage |
| memory_total_utilization | node mem utilization percent |
灵活的异常规则配置与可自定义的主动回避规则
针对异常规则的配置,Crane 支持静态阈值,基于 OPA 的灵活定义和多种算法支持,用户也可以根据接口自行定义自己的异常判断逻辑,实现灵活配置,具有较好的扩展能力;
针对主动回避规则,可以为业务设置优先级和 QoS 质量保障,在资源紧张时对低优业务进行抢占和压制,通过 NodeQOS 和 PodQOS 的配合,保障节点和业务的稳定性。 PodQOS 定义了可以选择 pod 被执行的具体 AvoidanceAction,同时支持具有如指定 QOSClass,priority 或具体 label 等丰富的 pod 关联方式,通过这两种方式,即可实现丰富和精确的回避策略,精准操作 workload,避免误伤。
比如可以结合弹性资源回收,只允许离线作业被执行驱逐等操作,避免主动回避操作对于高优先级业务的影响,误驱逐了重要业务,从而在资源紧张时将低优或者使用扩展资源的 pod 优先回收,保证了节点上的核心业务的稳定。
如下面的例子,为打有 preemptible_job: "true" 标签的 Pod 和 BestEffor pod 配置可驱逐。
apiVersion: ensurance.crane.io/v1alpha1
kind: PodQOS
metadata:
  name: all-elastic-pods
spec:
  allowedActions:
    - eviction
  labelSelector:
    matchLabels:
      preemptible_job: 'true'
---
apiVersion: ensurance.crane.io/v1alpha1
kind: PodQOS
metadata:
  name: all-be-pods
spec:
  allowedActions:
    - eviction
  scopeSelector:
    matchExpressions:
      - operator: In
        scopeName: QOSClass
        values:
          - BestEffort
与弹性资源搭配使用
为了避免主动回避操作对于高优先级业务的影响,比如误驱逐了重要业务,建议使用 PodQOS 关联使用了弹性资源的 workload,这样在执行动作的时候只会影响这些使用了空闲资源的 workload,保证了节点上的核心业务的稳定。
自定义指标接入干扰检测框架
- 提供了丰富的 pod 排序策略可以供自定义指标任意搭配组合,一个合适的 pod 排序策略组合,能够更快地将指标调整到水位线以下,也可以方便地实现自己的排序策略
- 能够避免过度操作,以 NodeQOS 中的指标值作为水位,操作到刚好低于水位线,能避免对低优先级服务的过度影响
- 一次操作过程兼顾多条不同指标的水位线,尽量短的时间内完成整个过程,避免对高优业务和整机的影响
- 在回避过程中考虑到实时指标暂时无法获取以及部分指标在 pod 被执行操作后无法量化的问题;由于低于水位线时会存在 restore 的反向过程,考虑到了避免指标在水位线附近来回摇摆的情况
用户按照规范完善自定义指标的一些属性和实现,即可在无需关心具体细节的情况下,复用以上能力和整个干扰检测主动回避过程,可以便捷扩展。
通过便捷的自定义指标复用流程的能力,用户可以定义一些各维度的指标用来保证集群的稳定,比如将弹性资源的总体使用量作为指标,即可实现无侵入的“离线资源大框”;比如将高优业务的关键指标作为指标,即可时刻保障高优业务的稳定运行。
预测算法增强的动态资源超卖
为了提高稳定性,通常用户在部署应用的时候会设置高于实际使用量的 Request 值,造成资源的浪费,为了提高节点的资源利用率,用户会搭配部署一些 BestEffort 的应用,利用闲置资源,实现超卖。但是这些应用由于缺乏资源 limit 和 request 的约束和相关信息,调度器依旧可能将这些 pod 调度到负载较高的节点上去,这与我们的初衷是不符的,所以最好能依据节点的空闲资源量进行调度。
crane 通过如下两种方式收集了节点的空闲资源量,综合后作为节点的空闲资源量,增强了资源评估的准确性:
这里以 cpu 为例,同时也支持内存的空闲资源回收和计算。
通过本地收集的 cpu 用量信息
nodeCpuCannotBeReclaimed := nodeCpuUsageTotal + exclusiveCPUIdle - extResContainerCpuUsageTotalexclusiveCPUIdle是指被 cpu manager policy 为 exclusive 的 pod 占用的 cpu 的空闲量,虽然这部分资源是空闲的,但是因为独占的原因,是无法被复用的,因此加上被算作已使用量extResContainerCpuUsageTotal是指被作为动态资源使用的 cpu 用量,需要减去以免被二次计算
创建节点 cpu 使用量的 TSP,默认情况下自动创建,会根据历史预测节点 CPU 用量
apiVersion: v1
data:
  spec: |
    predictionMetrics:
    - algorithm:
        algorithmType: dsp
        dsp:
          estimators:
            fft:
            - highFrequencyThreshold: "0.05"
              lowAmplitudeThreshold: "1.0"
              marginFraction: "0.2"
              maxNumOfSpectrumItems: 20
              minNumOfSpectrumItems: 10
          historyLength: 3d
          sampleInterval: 60s
      resourceIdentifier: cpu
      type: ExpressionQuery
      expressionQuery:
        expression: 'sum(count(node_cpu_seconds_total{mode="idle",instance=~"({{.metadata.name}})(:\\d+)?"}) by (mode, cpu)) - sum(irate(node_cpu_seconds_total{mode="idle",instance=~"({{.metadata.name}})(:\\d+)?"}[5m]))'
    predictionWindowSeconds: 3600
kind: ConfigMap
metadata:
  name: noderesource-tsp-template
  namespace: default
结合预测算法和当前实际用量推算节点的剩余可用资源,并将其作为拓展资源赋予节点,pod 可标明使用该扩展资源作为离线作业将空闲资源利用起来,以提升节点的资源利用率。
在部署 pod 时 limit 和 request 使用 gocrane.io/<$ResourceName>:<$value> 即可,如下所示:
spec:
  containers:
    - image: nginx
      imagePullPolicy: Always
      name: extended-resource-demo-ctr
      resources:
        limits:
          gocrane.io/cpu: '2'
          gocrane.io/memory: '2000Mi'
        requests:
          gocrane.io/cpu: '2'
          gocrane.io/memory: '2000Mi'
弹性资源限制功能
原生的 BestEffort 应用缺乏资源用量的公平保证,Crane 保证使用动态资源的 BestEffort pod 其 cpu 使用量被限制在其允许使用的合理范围内,agent 保证使用扩展资源的 pod 实际用量也不会超过其声明限制,同时在 cpu 竞争时也能按照各自声明量公平竞争;同时使用弹性资源的 pod 也会受到水位线功能的管理。
同样在部署 pod 时 limit 和 request 使用gocrane.io/<$ResourceName>:<$value>即可
适配场景
为了提升节点的负载,可以将一些离线作业或者重要性较低的作业通过使用弹性资源的方式调度部署到集群中,这类作业会使用空闲的弹性资源,搭配 QOS 的水位线保障,在节点出现负载较高的时候,也会优先被驱逐和压制,在保证高优先级业务稳定的前提下提升节点利用率。
总结
2022 年,腾讯云原生 FinOps Crane 项目组,结合行业及产业的发展趋势,联动中国产业互联网发展联盟、中国信通院、中国电子节能技术协会、FinOps 基金会及中国内外众多生态合作伙伴,开展及推动技术标准、国内联盟、国际开源、双碳升级等多维度的成果落地,输出了系列白皮书和标准指南,旨在助力企业和生态更良性发展和应用先进技术,达成降本增效,节能减排目标方向。
我们可以自己在 Kubernetes 集群中安装 crane 来获取这些相关功能,此外这些能力也都会在腾讯云 TKE 的原生节点产品 Housekeeper 中提供,新推出的 TKE Housekeeper 是腾讯云推出的全新 K8s 运维范式,可以帮助企业像管理 Workload 一样声明式管理 Node 节点,高效解决节点维护、资源规划等各种各样的运维问题。
毫无疑问,Crane 已经是 Kubernetes 集群中用于云资源分析和经济的最佳 FinOps 平台了。目前,腾讯云 Crane 已进入 CNCF LandScape,这意味着 Crane 已成为云原生领域的重要项目。面向未来,腾讯云还将持续反馈开源社区、共建开源生态,帮助更多企业通过云原生全面释放生产力,加速实现数字化和绿色化双转型。