自定义监控报警
上节课和大家讲解了 Prometheus Operator 的安装和基本使用方法,这节课给大家介绍如何在 Prometheus Operator 中添加一个自定义的监控项。
除了 Kubernetes 集群中的一些资源对象、节点以及组件需要监控,有的时候我们可能还需要根据实际的业务需求去添加自定义的监控项,添加一个自定义监控的步骤也是非常简单的。
- 第一步建立一个 ServiceMonitor 对象,用于 Prometheus 添加监控项
- 第二步为 ServiceMonitor 对象关联 metrics 数据接口的一个 Service 对象
- 第三步确保 Service 对象可以正确获取到 metrics 数据
接下来我们就来为大家演示如何添加 etcd 集群的监控。无论是 Kubernetes 集群外的还是使用 kubeadm 安装在集群内部的 etcd 集群,我们这里都将其视作集群外的独立集群,因为对于二者的使用方法没什么特殊之处。
etcd 监控
由于我们这里演示环境使用的是 kubeadm 搭建的集群,我们可以使用 kubectl 工具去获取 etcd 启动的相关参数:
$ kubectl get pods -n kube-system -l component=etcd
NAME           READY   STATUS    RESTARTS       AGE
etcd-master1   1/1     Running   19 (12m ago)   11d
$ kubectl get pods etcd-master1 -n kube-system -o yaml
......
spec:
  containers:
  - command:
    - etcd
    - --advertise-client-urls=https://192.168.0.106:2379
    - --cert-file=/etc/kubernetes/pki/etcd/server.crt
    - --client-cert-auth=true
    - --data-dir=/var/lib/etcd
    - --initial-advertise-peer-urls=https://192.168.0.106:2380
    - --initial-cluster=master1=https://192.168.0.106:2380
    - --key-file=/etc/kubernetes/pki/etcd/server.key
    - --listen-client-urls=https://127.0.0.1:2379,https://192.168.0.106:2379
    - --listen-metrics-urls=http://127.0.0.1:2381
    - --listen-peer-urls=https://192.168.0.106:2380
    - --name=master1
    - --peer-cert-file=/etc/kubernetes/pki/etcd/peer.crt
    - --peer-client-cert-auth=true
    - --peer-key-file=/etc/kubernetes/pki/etcd/peer.key
    - --peer-trusted-ca-file=/etc/kubernetes/pki/etcd/ca.crt
    - --snapshot-count=10000
    - --trusted-ca-file=/etc/kubernetes/pki/etcd/ca.crt
......
我们可以看到启动参数里面有一个 --listen-metrics-urls=http://127.0.0.1:2381 的配置,该参数就是来指定 metrics 接口运行在 2381 端口下面的,而且是 http 的协议,所以也不需要什么证书配置,这就比以前的版本要简单许多了,以前的版本需要用 https 协议访问,所以要配置对应的证书。
接下来我们直接创建对应的 ServiceMonitor 对象即可:
# kubernetesControlPlane-serviceMonitorEtcd.yaml
apiVersion: monitoring.coreos.com/v1
kind: ServiceMonitor
metadata:
  name: etcd-k8s
  namespace: monitoring
  labels:
    k8s-app: etcd-k8s
spec:
  jobLabel: k8s-app
  endpoints:
    - port: port
      interval: 15s
  selector:
    matchLabels:
      k8s-app: etcd
  namespaceSelector:
    matchNames:
      - kube-system
上面我们在 monitoring 命名空间下面创建了名为 etcd-k8s 的 ServiceMonitor 对象,基本属性和前面章节中的一致,匹配 kube-system 这个命名空间下面的具有 k8s-app=etcd 这个 label 标签的 Service,jobLabel 表示用于检索 job 任务名称的标签,由于 etcd 的 metrics 接口在 2381 端口下面,不需要 https 安全认证,所以用默认的配置即可。关于 ServiceMonitor 更多的配置属性,可以参考官方的 API 文档的描述。
然后我们直接创建这个 ServiceMonitor 对象即可:
$ kubectl apply -f kubernetesControlPlane-serviceMonitorEtcd.yaml
但实际上现在并不能监控到 etcd 集群,因为并没有一个满足 ServiceMonitor 条件的 Service 对象与之关联:
$ kubectl get svc -n kube-system -l k8s-app=etcd
No resources found.
所以接下来我们需要创建一个满足上面条件的 Service 对象,由于我们把 etcd 当成是集群外部的服务,所以要引入到集群中来我们就需要自定义 Endpoints 对象来创建 Service 对象了:
apiVersion: v1
kind: Service
metadata:
  name: etcd-k8s
  namespace: kube-system
  labels:
    k8s-app: etcd
spec:
  type: ClusterIP
  clusterIP: None # 一定要设置 clusterIP:None
  ports:
    - name: port
      port: 2381
---
apiVersion: v1
kind: Endpoints
metadata:
  name: etcd-k8s
  namespace: kube-system
  labels:
    k8s-app: etcd
subsets:
  - addresses:
      - ip: 192.168.31.75 # 指定etcd节点地址,如果是集群则继续向下添加
        nodeName: etc-master
    ports:
      - name: port
        port: 2381
我们这里创建的 Service 没有采用前面通过 label 标签的形式去匹配 Pod 的做法,因为前面我们说过很多时候我们创建的 etcd 集群是独立于集群之外的,这种情况下面我们就需要自定义一个 Endpoints,要注意 metadata 区域的内容要和 Service 保持一致,Service 的 clusterIP 设置为 None,新版本的 etcd 将 metrics 接口数据放置到了 2381 端口。直接创建该资源对象即可:
$ kubectl apply -f etcd-service.yaml
$ kubectl get svc -n kube-system -l k8s-app=etcd
NAME       TYPE        CLUSTER-IP   EXTERNAL-IP   PORT(S)    AGE
etcd-k8s   ClusterIP   None         <none>        2381/TCP   2d20h
创建完成后,隔一会儿去 Prometheus 的 Dashboard 中查看 targets,便会有 etcd 的监控项了:
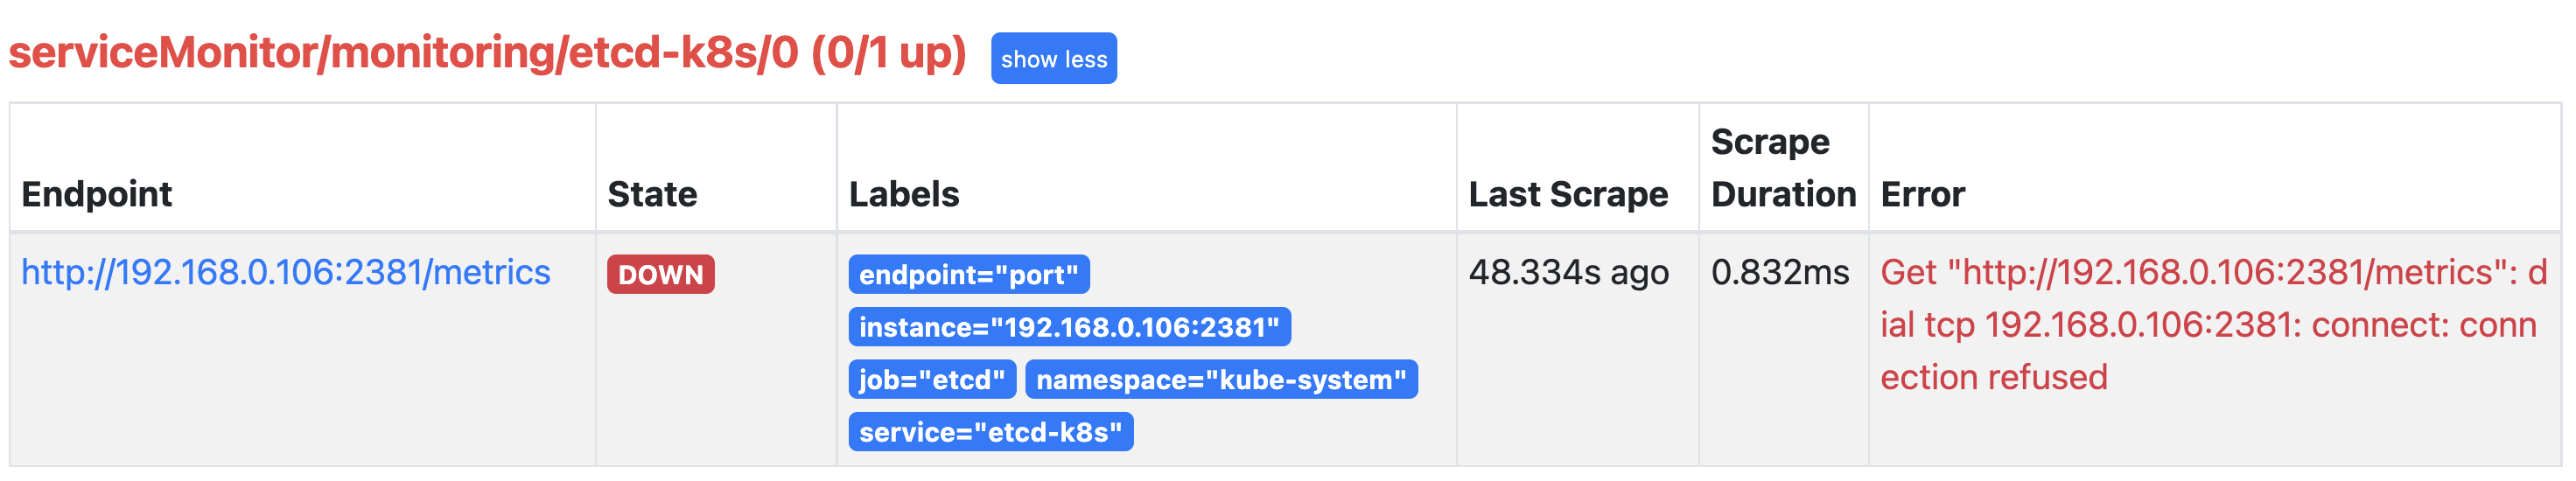
可以看到有一个明显的错误,2381 端口链接被拒绝,这是因为我们这里的 etcd 的 metrics 接口是监听在 127.0.0.1 这个 IP 上面的,所以访问会拒绝:
--listen-metrics-urls=http://127.0.0.1:2381
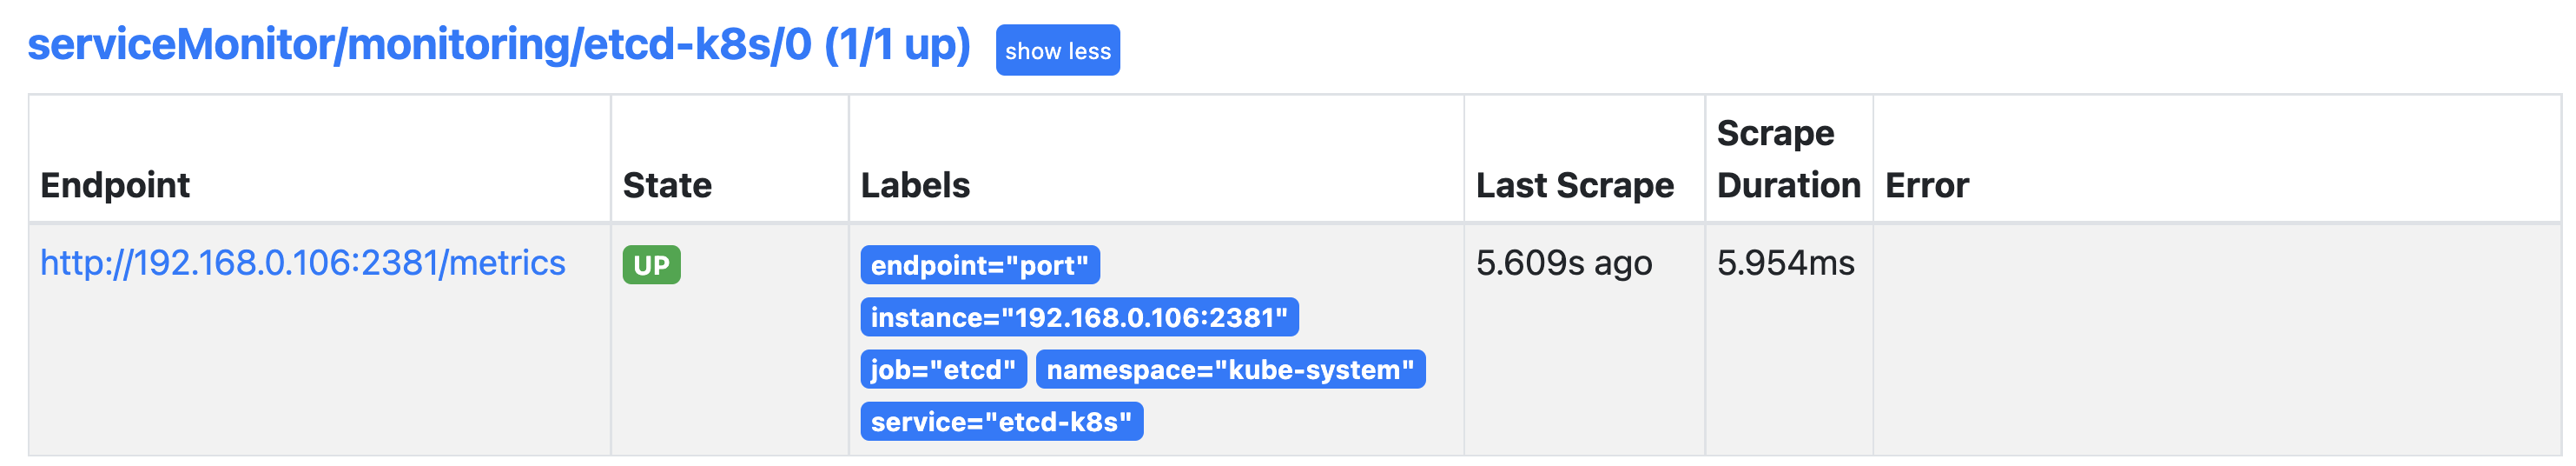
我们只需要在 /etc/kubernetes/manifest/ 目录下面(静态 Pod 默认的目录)的 etcd.yaml 文件中将上面的listen-metrics-urls 更改成节点 IP 即可:
--listen-metrics-urls=http://0.0.0.0:2381
当 etcd 重启生效后,查看 etcd 这个监控任务就正常了:
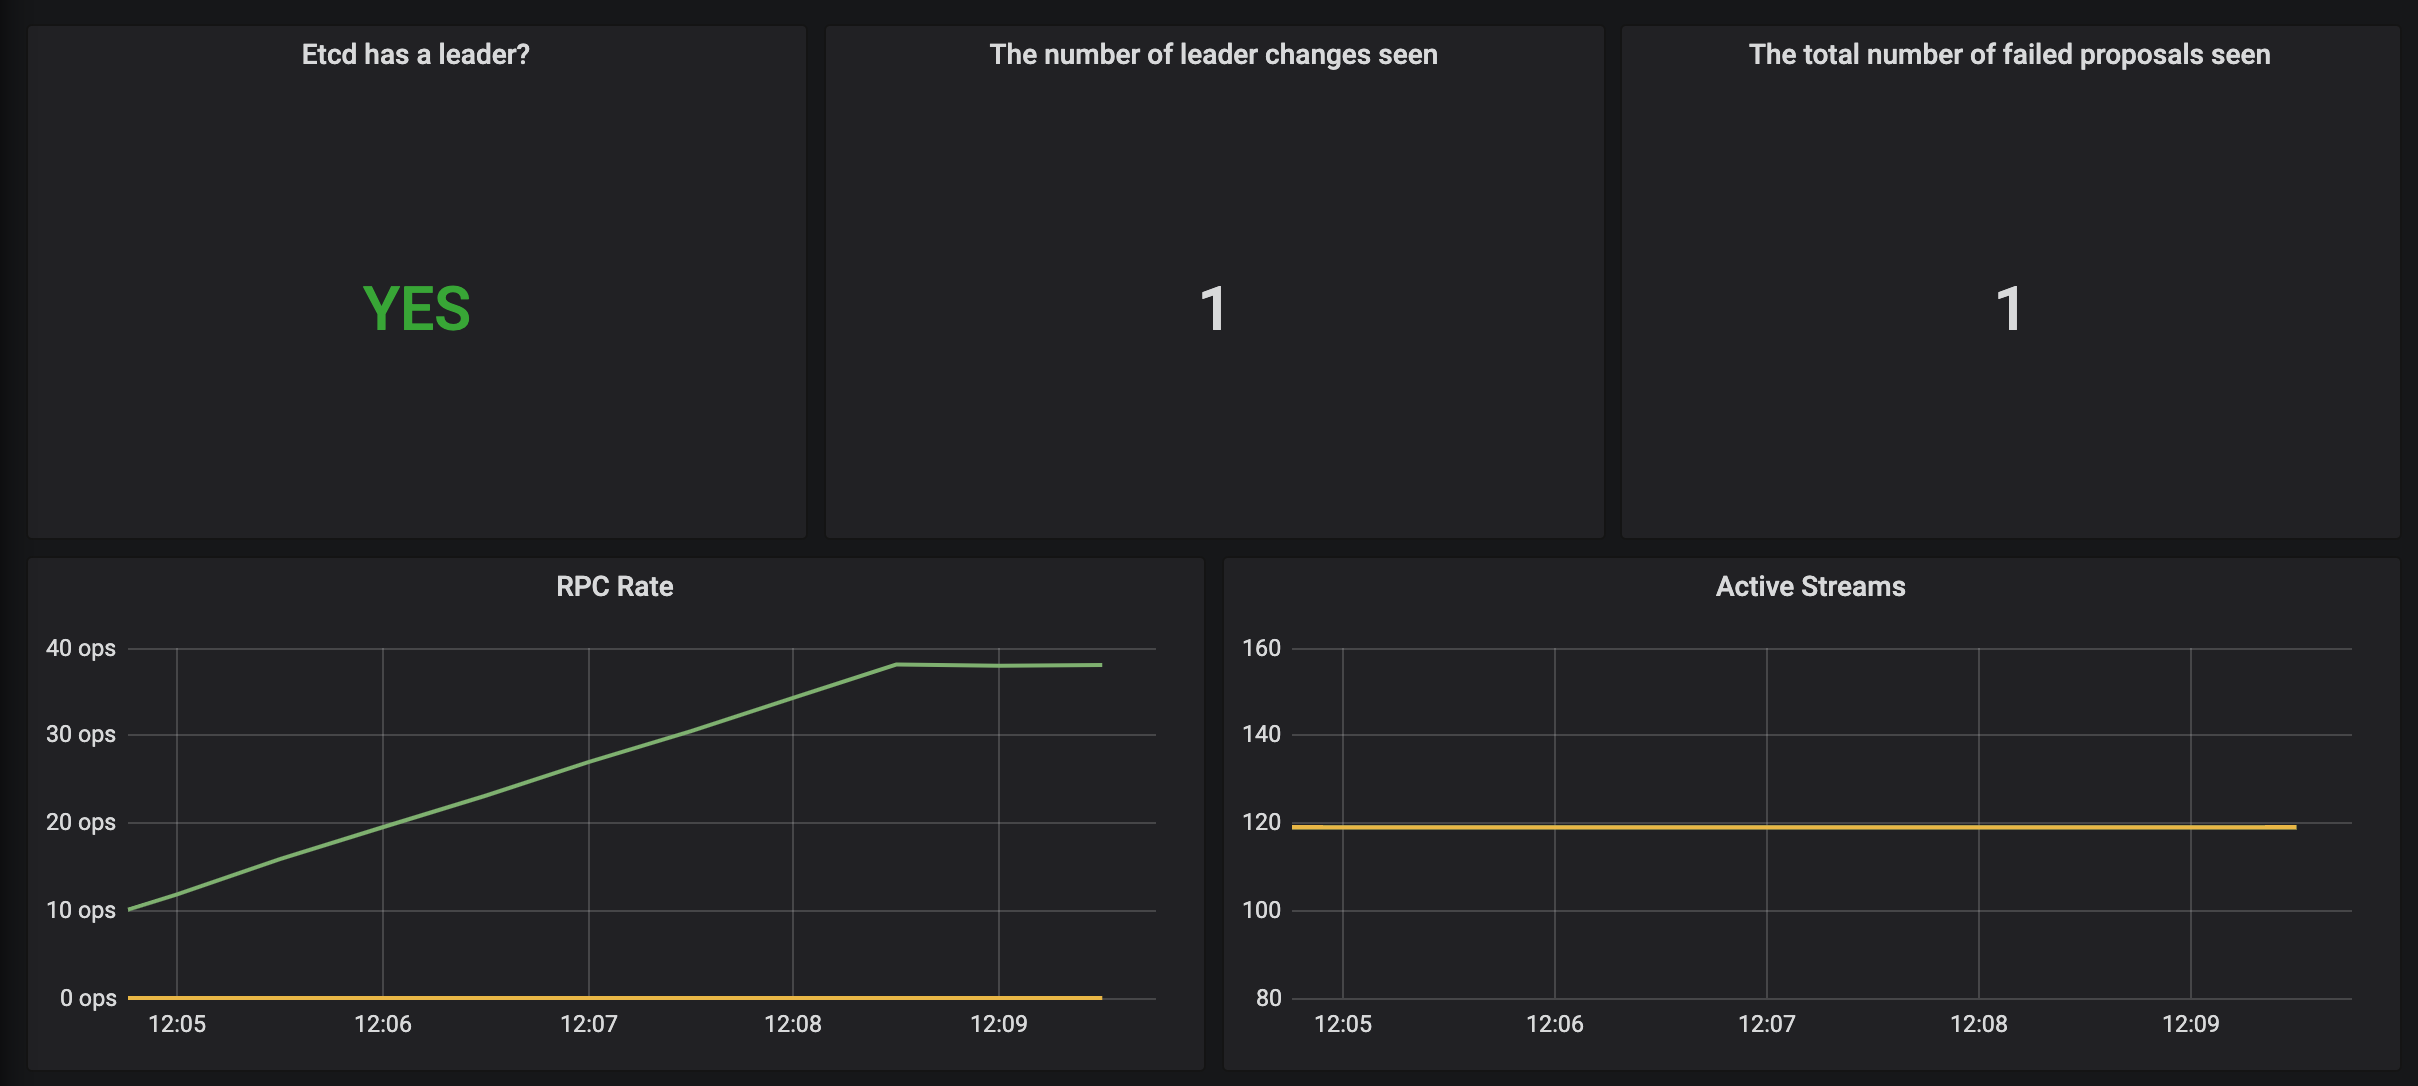
数据采集到后,可以在 grafana 中导入编号为 3070 的 dashboard,就可以获取到 etcd 的监控图表:
配置 PrometheusRule
现在我们知道怎么自定义一个 ServiceMonitor 对象了,但是如果需要自定义一个报警规则的话呢?我们去查看 Prometheus Dashboard 的 Alert 页面下面就已经有很多报警规则了,这一系列的规则其实都来自于项目 https://github.com/kubernetes-monitoring/kubernetes-mixin,我们都通过 Prometheus Operator 安装配置上了。
但是这些报警信息是哪里来的呢?他们应该用怎样的方式通知我们呢?我们知道之前我们使用自定义的方式可以在 Prometheus 的配置文件之中指定 AlertManager 实例和 报警的 rules 文件,现在我们通过 Operator 部署的呢?我们可以在 Prometheus Dashboard 的 Config 页面下面查看关于 AlertManager 的配置:
alerting:
  alert_relabel_configs:
    - separator: ;
      regex: prometheus_replica
      replacement: $1
      action: labeldrop
  alertmanagers:
    - follow_redirects: true
      enable_http2: true
      scheme: http
      path_prefix: /
      timeout: 10s
      api_version: v2
      relabel_configs:
        - source_labels: [__meta_kubernetes_service_name]
          separator: ;
          regex: alertmanager-main
          replacement: $1
          action: keep
        - source_labels: [__meta_kubernetes_endpoint_port_name]
          separator: ;
          regex: web
          replacement: $1
          action: keep
      kubernetes_sd_configs:
        - role: endpoints
          kubeconfig_file: ''
          follow_redirects: true
          enable_http2: true
          namespaces:
            own_namespace: false
            names:
              - monitoring
rule_files:
  - /etc/prometheus/rules/prometheus-k8s-rulefiles-0/*.yaml
上面 alertmanagers 的配置我们可以看到是通过 role 为 endpoints 的 kubernetes 的自动发现机制获取的,匹配的是服务名为 alertmanager-main,端口名为 web 的 Service 服务,我们可以查看下 alertmanager-main 这个 Service:
$ kubectl describe svc alertmanager-main -n monitoring
Name:                     alertmanager-main
Namespace:                monitoring
Labels:                   app.kubernetes.io/component=alert-router
                          app.kubernetes.io/instance=main
                          app.kubernetes.io/name=alertmanager
                          app.kubernetes.io/part-of=kube-prometheus
                          app.kubernetes.io/version=0.24.0
Annotations:              <none>
Selector:                 app.kubernetes.io/component=alert-router,app.kubernetes.io/instance=main,app.kubernetes.io/name=alertmanager,app.kubernetes.io/part-of=kube-prometheus
Type:                     NodePort
IP Family Policy:         SingleStack
IP Families:              IPv4
IP:                       10.109.67.21
IPs:                      10.109.67.21
Port:                     web  9093/TCP
TargetPort:               web/TCP
NodePort:                 web  32033/TCP
Endpoints:                10.244.1.193:9093,10.244.2.208:9093,10.244.2.210:9093
Port:                     reloader-web  8080/TCP
TargetPort:               reloader-web/TCP
NodePort:                 reloader-web  30181/TCP
Endpoints:                10.244.1.193:8080,10.244.2.208:8080,10.244.2.210:8080
Session Affinity:         ClientIP
External Traffic Policy:  Cluster
Events:                   <none>
可以看到服务名正是 alertmanager-main,Port 定义的名称也是 web,符合上面的规则,所以 Prometheus 和 AlertManager 组件就正确关联上了。而对应的报警规则文件位于:/etc/prometheus/rules/prometheus-k8s-rulefiles-0/ 目录下面所有的 YAML 文件。我们可以进入 Prometheus 的 Pod 中验证下该目录下面是否有 YAML 文件:
$ kubectl exec -it prometheus-k8s-0 /bin/sh -n monitoringkubectl exec -it prometheus-k8s-0 -n monitoring -- /bin/sh
/prometheus $ ls /etc/prometheus/rules/prometheus-k8s-rulefiles-0/
monitoring-alertmanager-main-rules-79543974-2f8e-4c5f-9d23-2c349c38ff1d.yaml
monitoring-grafana-rules-8fc5e057-099e-4546-b6bd-d8fb1107c24d.yaml
monitoring-kube-prometheus-rules-79b18777-2df4-4e43-84a8-193053400842.yaml
monitoring-kube-state-metrics-rules-8341740e-f2b7-48e9-82c2-bd6b979f1da2.yaml
monitoring-kubernetes-monitoring-rules-4b169784-b211-4449-922f-52fb2efd839c.yaml
monitoring-node-exporter-rules-b5f0f4d3-aa18-4e7d-836f-ef0a8fda7569.yaml
monitoring-prometheus-k8s-prometheus-rules-9560ae4f-764c-4ba4-9a37-2fedb56773c7.yaml
monitoring-prometheus-operator-rules-7d3a1645-efe3-4214-b825-c77c39ceb0d4.yaml
/prometheus $ cat /etc/prometheus/rules/prometheus-k8s-rulefiles-0/monitoring-kube-prometheus-rules-79b18777-2df4-4e43-84a8-193053400842.yaml
groups:
- name: general.rules
  rules:
  - alert: TargetDown
    annotations:
      description: '{{ printf "%.4g" $value }}% of the {{ $labels.job }}/{{ $labels.service
        }} targets in {{ $labels.namespace }} namespace are down.'
      runbook_url: https://runbooks.prometheus-operator.dev/runbooks/general/targetdown
      summary: One or more targets are unreachable.
    expr: 100 * (count(up == 0) BY (job, namespace, service) / count(up) BY (job,
      namespace, service)) > 10
    for: 10m
    labels:
      severity: warning
......
这个 YAML 文件实际上就是我们之前创建的一个 PrometheusRule 文件包含的内容:
$ cat kubePrometheus-prometheusRule.yaml
apiVersion: monitoring.coreos.com/v1
kind: PrometheusRule
metadata:
  labels:
    app.kubernetes.io/component: exporter
    app.kubernetes.io/name: kube-prometheus
    app.kubernetes.io/part-of: kube-prometheus
    prometheus: k8s
    role: alert-rules
  name: kube-prometheus-rules
  namespace: monitoring
spec:
  groups:
  - name: general.rules
    rules:
    - alert: TargetDown
      annotations:
        description: '{{ printf "%.4g" $value }}% of the {{ $labels.job }}/{{ $labels.service
          }} targets in {{ $labels.namespace }} namespace are down.'
        runbook_url: https://runbooks.prometheus-operator.dev/runbooks/general/targetdown
        summary: One or more targets are unreachable.
      expr: 100 * (count(up == 0) BY (job, namespace, service) / count(up) BY (job,
        namespace, service)) > 10
      for: 10m
      labels:
        severity: warning
......
我们这里的 PrometheusRule 的 name 为 kube-prometheus-rules,namespace 为 monitoring,我们可以猜想到我们创建一个 PrometheusRule 资源对象后,会自动在上面的 prometheus-k8s-rulefiles-0 目录下面生成一个对应的 <namespace>-<name>-<xxx-id>.yaml 文件,所以如果以后我们需要自定义一个报警选项的话,只需要定义一个 PrometheusRule 资源对象即可。至于为什么 Prometheus 能够识别这个 PrometheusRule 资源对象呢?这就需要查看我们创建的 prometheus 这个资源对象了,里面有非常重要的一个属性 ruleSelector,用来匹配 rule 规则的过滤器,我们这里没有过滤,所以可以匹配所有的,假设要求匹配具有 prometheus=k8s 和 role=alert-rules 标签的 PrometheusRule 资源对象,则可以添加下面的配置:
ruleSelector:
  matchLabels:
    prometheus: k8s
    role: alert-rules
所以我们要想自定义一个报警规则,只需要创建一个能够被 prometheus 对象匹配的 PrometheusRule 对象即可,比如现在我们添加一个 etcd 是否可用的报警,我们知道 etcd 整个集群有一半以上的节点可用的话集群就是可用的,所以我们判断如果不可用的 etcd 数量超过了一半那么就触发报警,创建文件 prometheus-etcdRules.yaml:
apiVersion: monitoring.coreos.com/v1
kind: PrometheusRule
metadata:
  labels:
    prometheus: k8s
    role: alert-rules
  name: etcd-rules
  namespace: monitoring
spec:
  groups:
    - name: etcd
      rules:
        - alert: EtcdClusterUnavailable
          annotations:
            summary: etcd cluster small
            description: If one more etcd peer goes down the cluster will be unavailable
          expr: |
            count(up{job="etcd"} == 0) > (count(up{job="etcd"}) / 2 - 1)
          for: 3m
          labels:
            severity: critical
创建完成后,隔一会儿再去容器中查看下 rules 文件夹:
$ kubectl apply -f prometheus-etcdRules.yaml
prometheusrule.monitoring.coreos.com/etcd-rules created
$ kubectl exec -it prometheus-k8s-0 /bin/sh -n monitoring
Defaulting container name to prometheus.
Use 'kubectl describe pod/prometheus-k8s-0 -n monitoring' to see all of the containers in this pod.
/prometheus $ ls /etc/prometheus/rules/prometheus-k8s-rulefiles-0/
monitoring-etcd-rules.yaml            monitoring-prometheus-k8s-rules.yaml
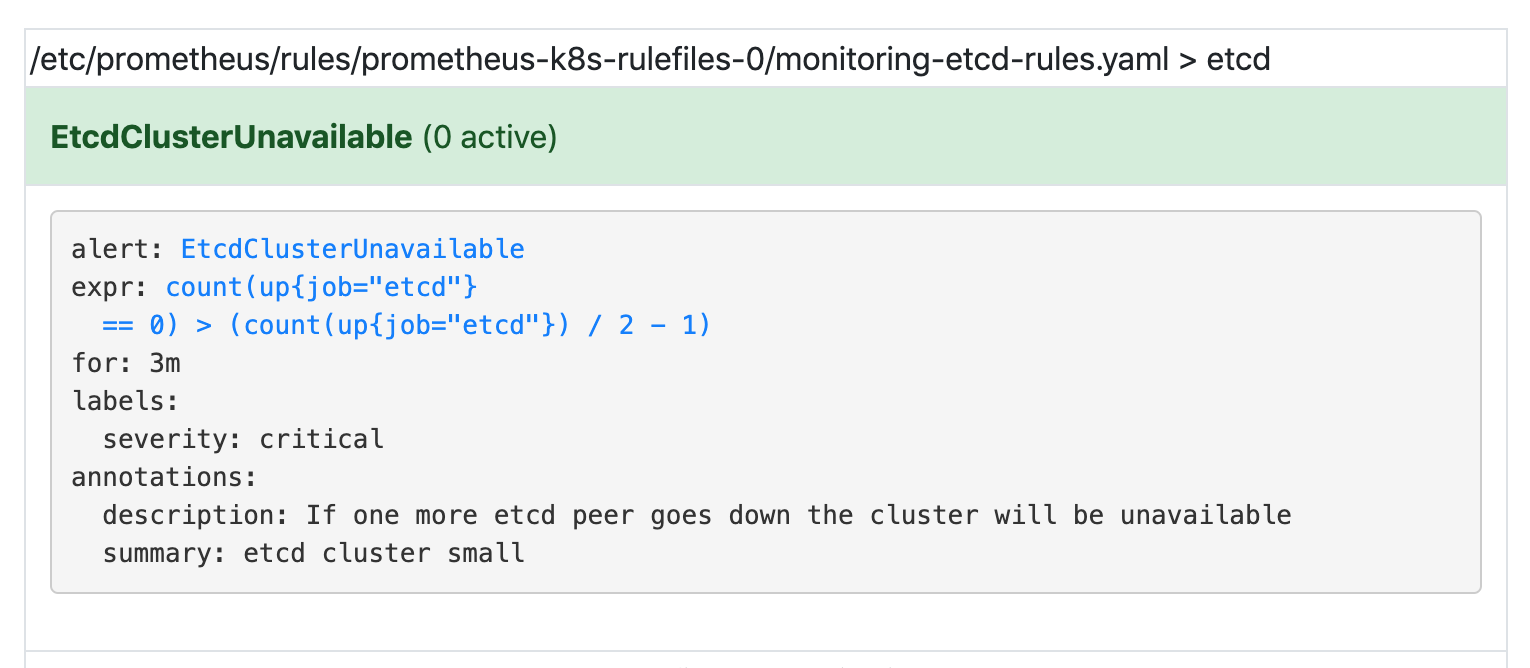
可以看到我们创建的 rule 文件已经被注入到了对应的 rulefiles 文件夹下面了,证明我们上面的设想是正确的。然后再去 Prometheus Dashboard 的 Alert 页面下面就可以查看到上面我们新建的报警规则了:
配置报警
我们知道了如何去添加一个报警规则配置项,但是这些报警信息用怎样的方式去发送呢?前面的课程中我们知道我们可以通过 AlertManager 的配置文件去配置各种报警接收器,现在我们是通过 Operator 提供的 alertmanager 资源对象创建的组件,应该怎样去修改配置呢?
首先我们去 Alertmanager 的页面上 status 路径下面查看 AlertManager 的配置信息:
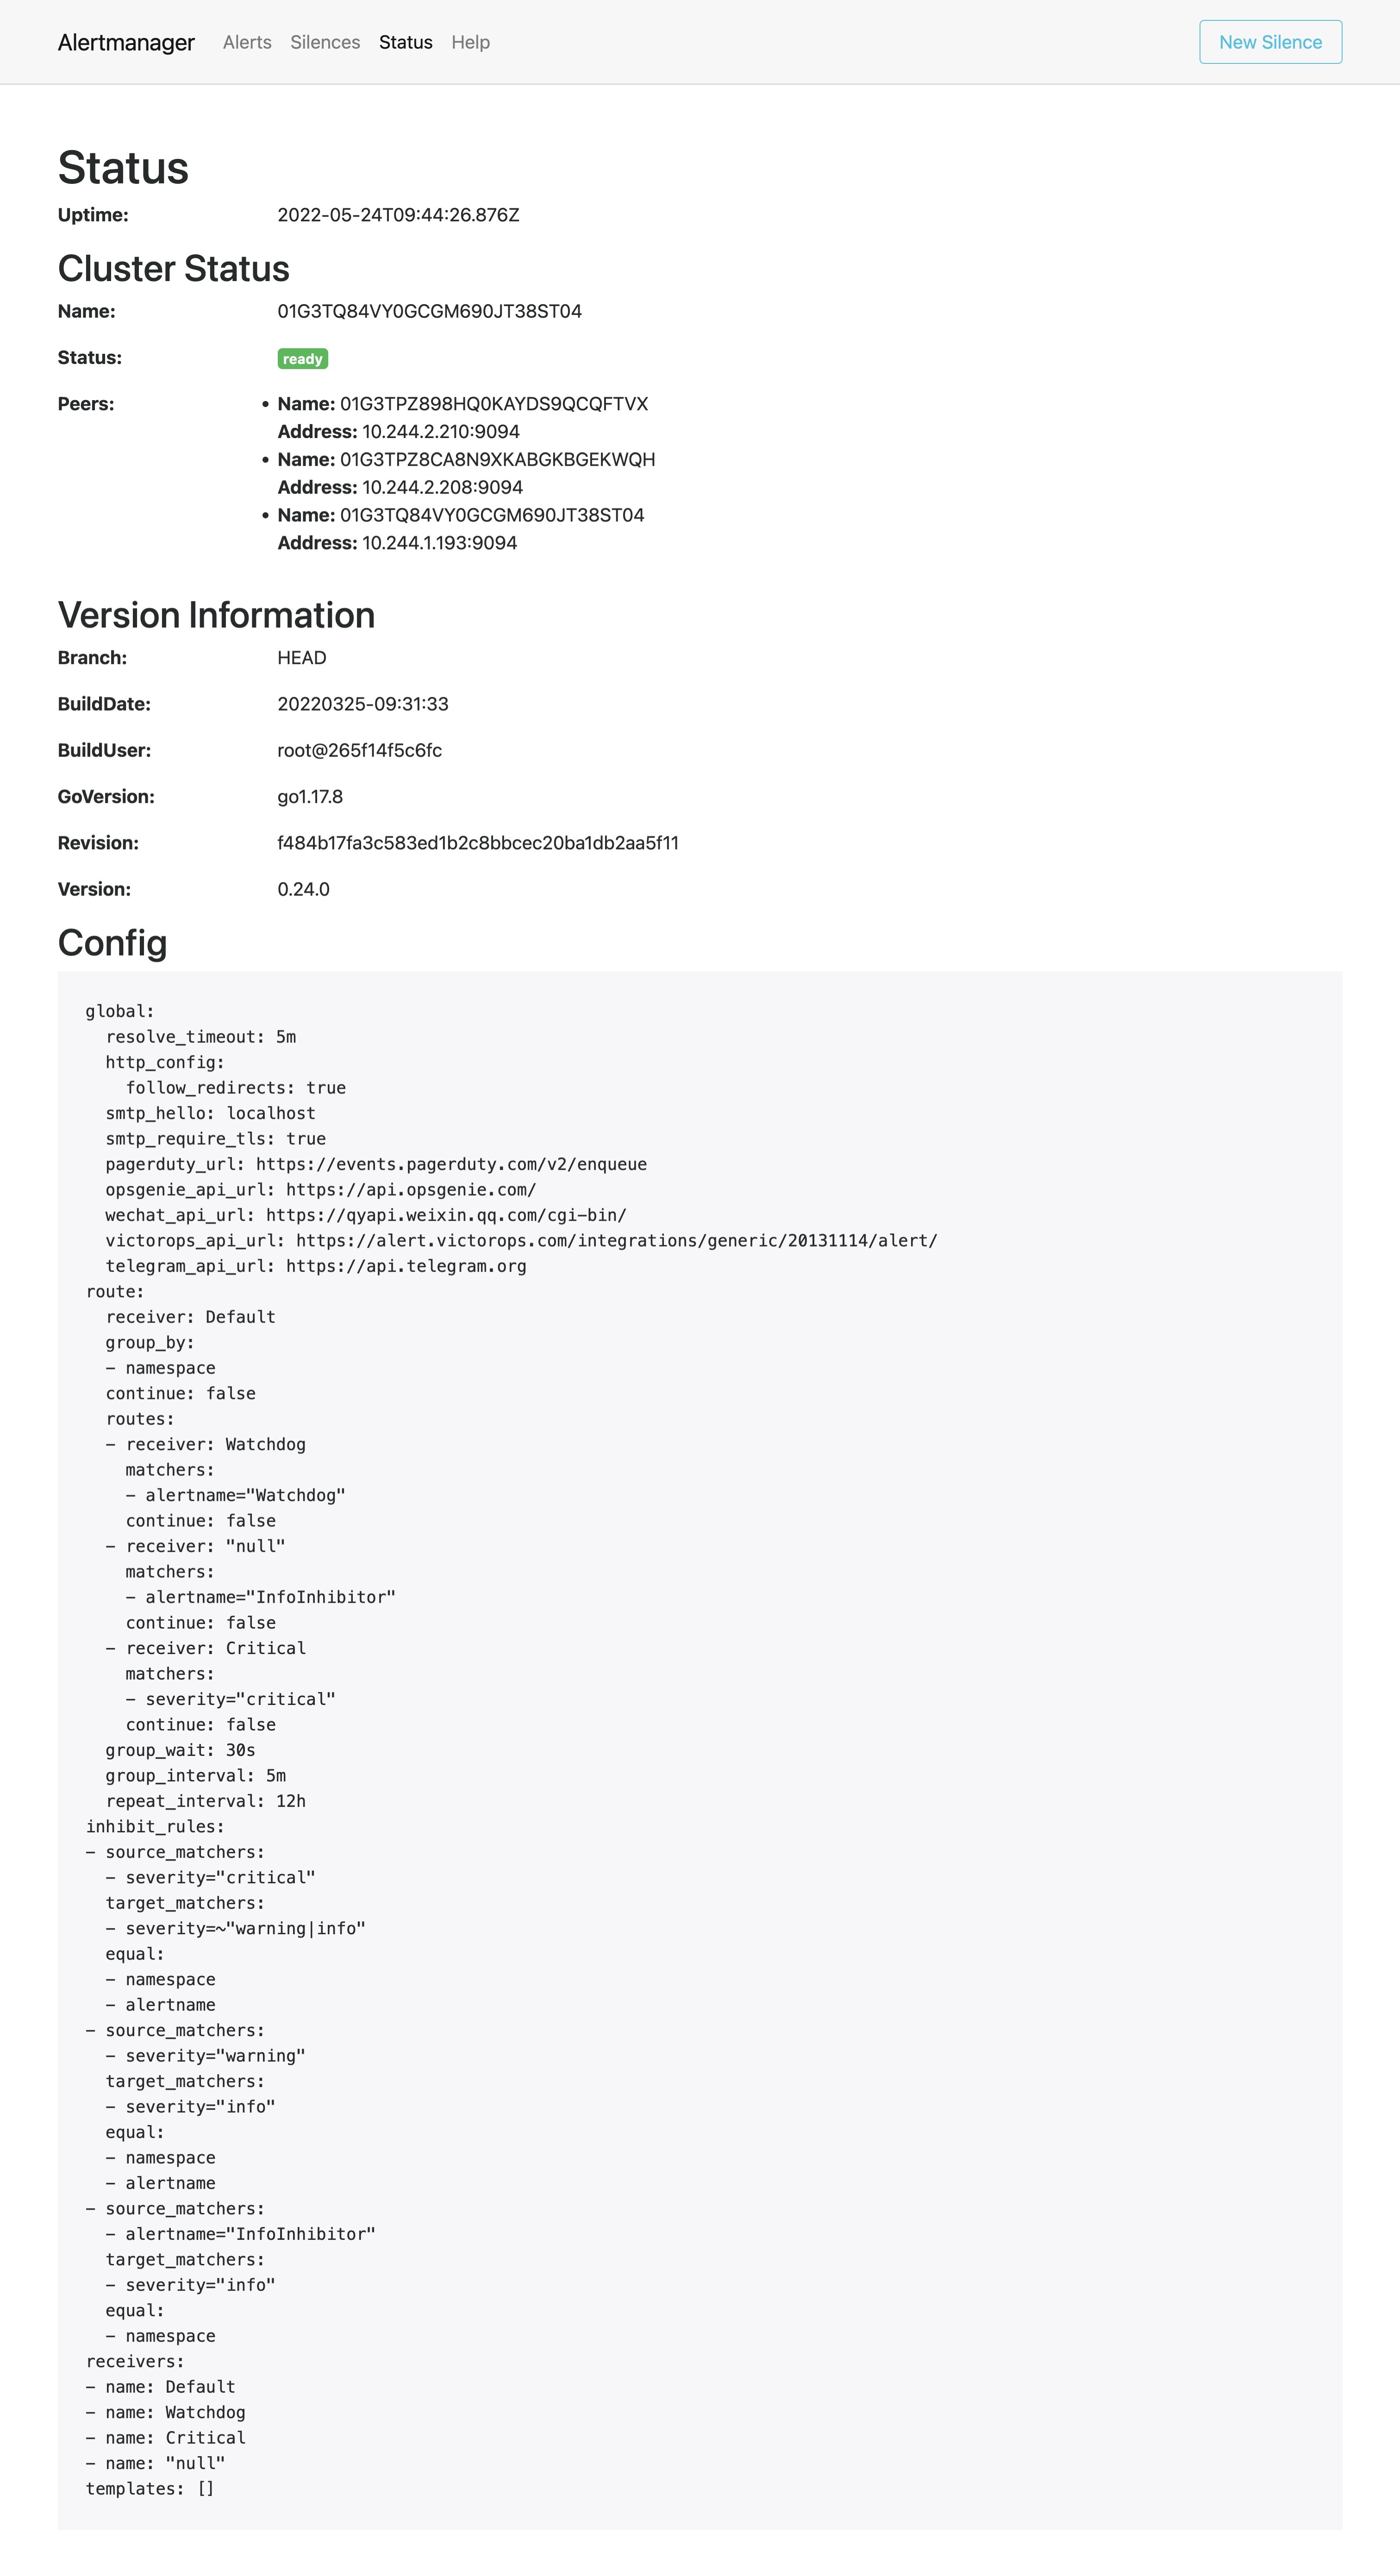
这些配置信息实际上是来自于 Prometheus-Operator 自动创建的名为 alertmanager-main-generated 的 Secret 对象:
$ kubectl get secret alertmanager-main-generated -n monitoring -o json | jq -r '.data."alertmanager.yaml"' | base64 --decode
"global":
  "resolve_timeout": "5m"
"inhibit_rules":
- "equal":
  - "namespace"
  - "alertname"
  "source_matchers":
  - "severity = critical"
  "target_matchers":
  - "severity =~ warning|info"
- "equal":
  - "namespace"
  - "alertname"
  "source_matchers":
  - "severity = warning"
  "target_matchers":
  - "severity = info"
- "equal":
  - "namespace"
  "source_matchers":
  - "alertname = InfoInhibitor"
  "target_matchers":
  - "severity = info"
"receivers":
- "name": "Default"
- "name": "Watchdog"
- "name": "Critical"
- "name": "null"
"route":
  "group_by":
  - "namespace"
  "group_interval": "5m"
  "group_wait": "30s"
  "receiver": "Default"
  "repeat_interval": "12h"
  "routes":
  - "matchers":
    - "alertname = Watchdog"
    "receiver": "Watchdog"
  - "matchers":
    - "alertname = InfoInhibitor"
    "receiver": "null"
  - "matchers":
    - "severity = critical"
    "receiver": "Critical"
我们可以看到内容和上面查看的配置信息是一致的,所以如果我们想要添加自己的接收器,我们就可以直接更改这个文件,但是这里的内容是 base64 编码过后的,如果手动添加内容就非常不方便,为此 Prometheus-Operator 新增了一个 AlertmanagerConfig 的 CRD,比如我们将 Critical 这个接收器的报警信息都发送到钉钉进行报警。
首先在 monitoring 命名空间下面部署一个简单的钉钉 webhook 处理器,前面 Alertmanager 章节已经学习过,这里就不赘述了。
然后新建一个 AlertmanagerConfig 类型的资源对象,可以通过 kubectl explain alertmanagerconfig 或者在线 API 文档来查看字段的含义
# alertmanager-config.yaml
apiVersion: monitoring.coreos.com/v1alpha1
kind: AlertmanagerConfig
metadata:
  name: dinghook
  namespace: monitoring
  labels:
    alertmanagerConfig: example
spec:
  receivers:
    - name: Critical
      webhookConfigs:
        - url: http://<webhook-url>
          sendResolved: true
  route:
    groupBy: ['namespace']
    groupWait: 30s
    groupInterval: 5m
    repeatInterval: 12h
    receiver: Critical
    routes:
      - receiver: Critical
        match:
          severity: critical
不过如果直接创建上面的配置是不会生效的,我们需要添加一个 Label 标签,并在 Alertmanager 的资源对象中通过标签来关联上面的这个对象,比如我们这里新增了一个 Label 标签:alertmanagerConfig: example,然后需要重新更新 Alertmanager 对象,添加 alertmanagerConfigSelector 属性去匹配 AlertmanagerConfig 资源对象:
# alertmanager-alertmanager.yaml
apiVersion: monitoring.coreos.com/v1
kind: Alertmanager
metadata:
  labels:
    alertmanager: main
  name: main
  namespace: monitoring
spec:
  image: quay.io/prometheus/alertmanager:v0.21.0
  nodeSelector:
    kubernetes.io/os: linux
  replicas: 3
  securityContext:
    fsGroup: 2000
    runAsNonRoot: true
    runAsUser: 1000
  serviceAccountName: alertmanager-main
  version: v0.21.0
  configSecret:
  alertmanagerConfigSelector: # 匹配 AlertmanagerConfig 的标签
    matchLabels:
      alertmanagerConfig: example
现在我们重新更新上面的资源对象:
kubectl apply -f alertmanager-config.yaml
kubectl apply -f alertmanager-alertmanager.yaml
更新完成后默认的配置会和我们创建的配置进行合并,我们可以重新查看生成的 Secret 资源对象内容,也可以直接查看 Alertmanager 的 WEB UI 界面的配置内容:
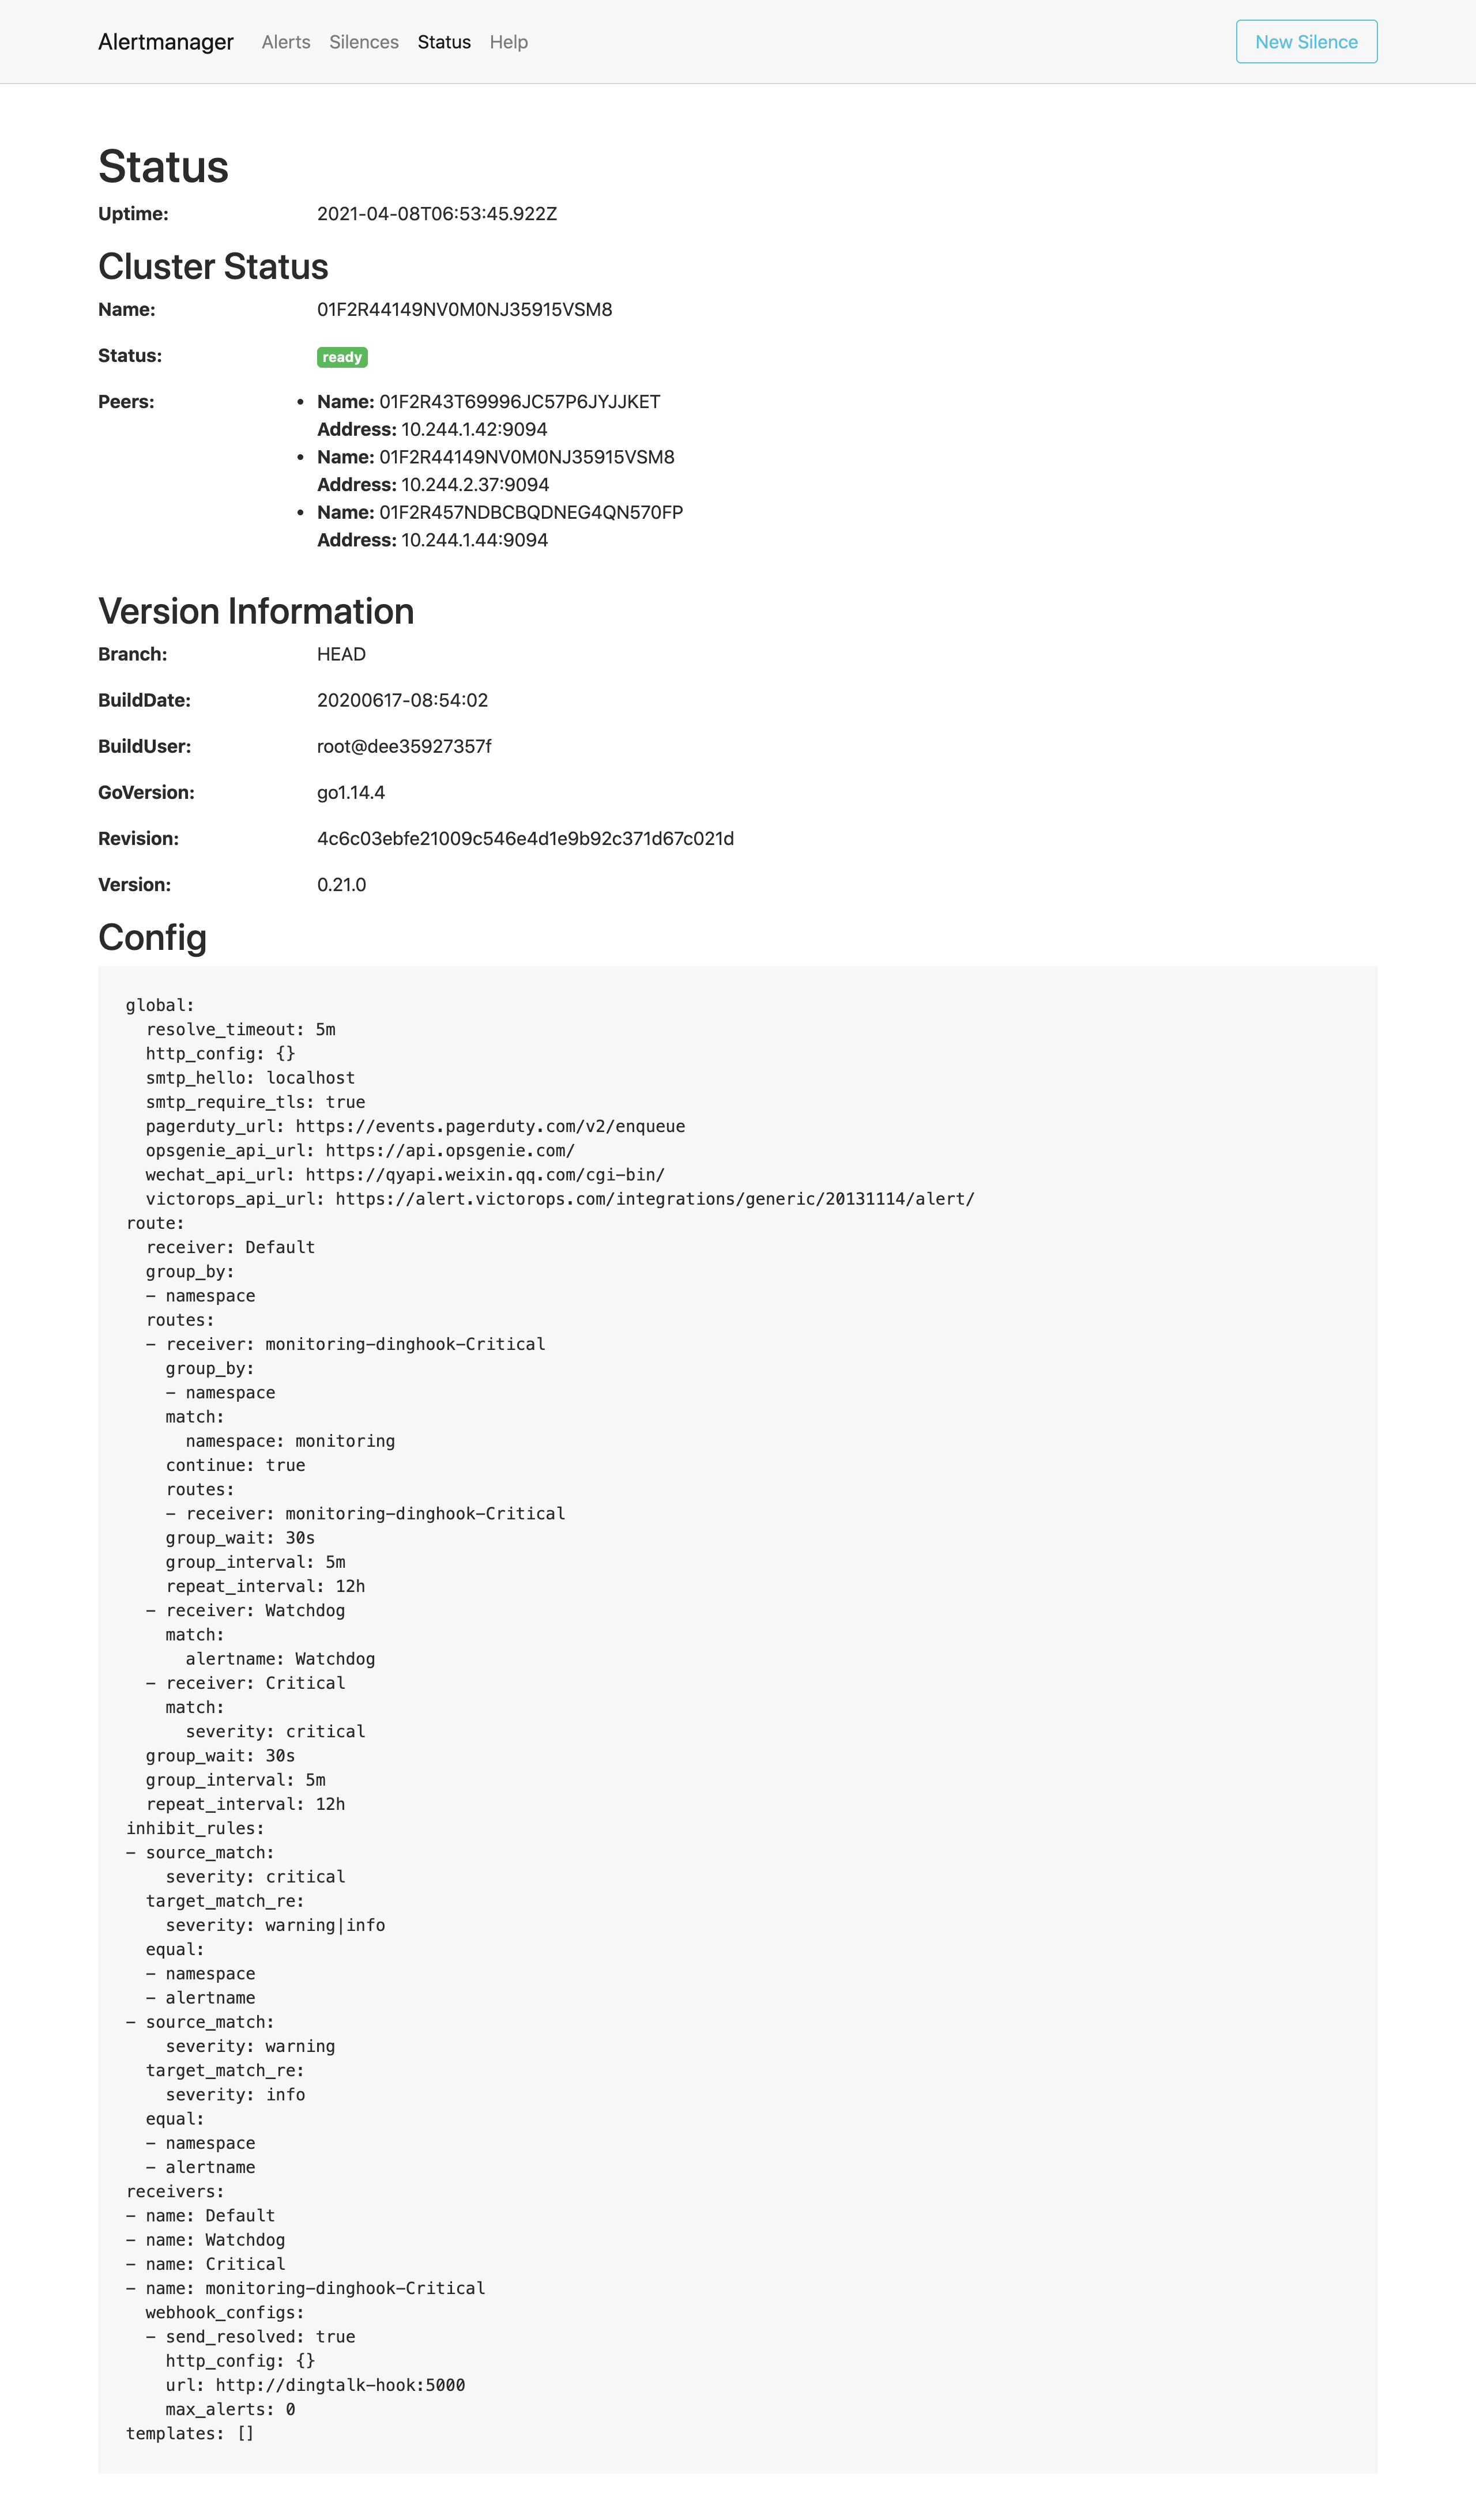
可以看到我们在 AlertmanagerConfig 里面定义的名为 Critical 的 Receiver,在最终生成的配置中名称了 monitoring-dinghook-Critical,格式为 <namespace>-<name>-<receiver name>。
到这里我们就完成了 Prometheus Operator 的自定义监控和报警。