日志报警
对于生产环境以及一个有追求的运维人员来说,哪怕是毫秒级别的宕机也是不能容忍的。对基础设施及应用进行适当的日志记录和监控非常有助于解决问题,还可以帮助优化成本和资源,以及帮助检测以后可能会发生的一些问题。前面我们学习使用了 Prometheus 来进行监控报警,但是如果我们使用 Loki 收集日志是否可以根据采集的日志来进行报警呢?答案是肯定的,而且有两种方式可以来实现:Promtail 中的 metrics 阶段和 Loki 的 ruler 组件。
测试应用
比如现在我们有一个如下所的 nginx 应用用于 Loki 日志报警:
# nginx-deploy.yaml
apiVersion: apps/v1
kind: Deployment
metadata:
  name: nginx
spec:
  selector:
    matchLabels:
      app: nginx
  template:
    metadata:
      labels:
        app: nginx
    spec:
      containers:
        - name: nginx
          image: nginx:1.7.9
          ports:
            - containerPort: 80
---
apiVersion: v1
kind: Service
metadata:
  name: nginx
  labels:
    app: nginx
spec:
  ports:
    - name: nginx
      port: 80
      protocol: TCP
  selector:
    app: nginx
  type: NodePort
为方便测试,我们这里使用 NodePort 类型的服务来暴露应用,直接安装即可:
$ kubectl apply -f nginx-deploy.yaml
$  kubectl get pods
NAME                           READY   STATUS    RESTARTS      AGE
nginx-5d59d67564-ll9xf         1/1     Running   0             16s
$ kubectl get svc
NAME         TYPE        CLUSTER-IP     EXTERNAL-IP   PORT(S)        AGE
kubernetes   ClusterIP   10.96.0.1      <none>        443/TCP        91d
nginx        NodePort    10.99.153.32   <none>        80:31313/TCP   22s
我们可以通过如下命令来来模拟每隔 10s 访问 Nginx 应用:
$ while true; do curl --silent --output /dev/null --write-out '%{http_code}' http://192.168.0.106:31313; sleep 10; echo; done
200
200
metrics 阶段
前面我们提到在 Promtail 中通过一系列 Pipeline 来处理日志,其中就包括一个 metrics 的阶段,可以根据我们的需求来增加一个监控指标,这就是我们需要实现的基于日志的监控报警的核心点,通过结构化日志,增加监控指标,然后使用 Prometheus 结合 Alertmanager 完成之前我们非常熟悉的监控报警。
首先我们需要安装 Prometheus 与 Alertmanager,可以手动安装,也可以使用 Prometheus Operator 的方式,可以参考监控报警章节相关内容,比如这里我们选择使用 Prometheus Operator 的方式。
前面我们介绍了几种 Loki 的部署方式,这里我们就保留上节微服务模式的 Loki 集群,接下来我们需要重新配置 Promtail,为其添加一个 metrics 处理阶段,使用如下所示的 values 文件重新安装。
# ci/metrics-values.yaml
rbac:
  pspEnabled: false
config:
  clients:
    - url: http://loki-loki-distributed-gateway/loki/api/v1/push
  snippets:
    pipelineStages:
      - cri: {}
      - match:
          selector: '{app="nginx"}'
          stages:
            - regex:
                expression: '.*(?P<hits>GET /.*)'
            - metrics:
                nginx_hits:
                  type: Counter
                  description: 'Total nginx requests'
                  source: hits
                  config:
                    action: inc
serviceMonitor:
  enabled: true
  additionalLabels:
    app: prometheus-operator
    release: prometheus
上面最重要的部分就是为 Promtail 添加了 pipelineStages 配置,用于对日志行进行转换,在这里我们添加了一个 match 的阶段,会去匹配具有 app=nginx 这样的日志流数据,然后下一个阶段是利用正则表达式过滤出包含 GET 关键字的日志行。
在 metrics 指标阶段,我们定义了一个 nginx_hits 的指标,Promtail 通过其 /metrics 端点暴露这个自定义的指标数据。这里我们定义的是一个 Counter 类型的指标,当从 regex 阶段匹配上后,这个计数器就会递增。
为了在 Prometheus 中能够这个指标,我们通过 promtail.serviceMonitor.enable=true 开启了一个 ServiceMonitor。接下来重新更新 Loki 应用,使用如下所示的命令即可:
$ helm upgrade --install loki -n logging -f ci/metrics-values.yaml .
更新完成后会创建一个 ServiceMonitor 对象用于发现 Promtail 的指标数据:
$ kubectl get servicemonitor -n logging
NAME            AGE
loki-promtail   10s
如果你使用的 Prometheus-Operator 默认不能发现 logging 命名空间下面的数据,则需要创建如下所示的一个 Role 权限:
apiVersion: rbac.authorization.k8s.io/v1
kind: Role
metadata:
  labels:
    app.kubernetes.io/component: prometheus
    app.kubernetes.io/name: prometheus
    app.kubernetes.io/part-of: kube-prometheus
    app.kubernetes.io/version: 2.26.0
  name: prometheus-k8s
  namespace: logging
rules:
  - apiGroups:
      - ''
    resources:
      - services
      - endpoints
      - pods
    verbs:
      - get
      - list
      - watch
  - apiGroups:
      - extensions
    resources:
      - ingresses
    verbs:
      - get
      - list
      - watch
  - apiGroups:
      - networking.k8s.io
    resources:
      - ingresses
    verbs:
      - get
      - list
      - watch
---
apiVersion: rbac.authorization.k8s.io/v1
kind: RoleBinding
metadata:
  name: prometheus-k8s
  namespace: logging
roleRef:
  apiGroup: rbac.authorization.k8s.io
  kind: Role
  name: prometheus-k8s
subjects:
  - kind: ServiceAccount
    name: prometheus-k8s
    namespace: monitoring
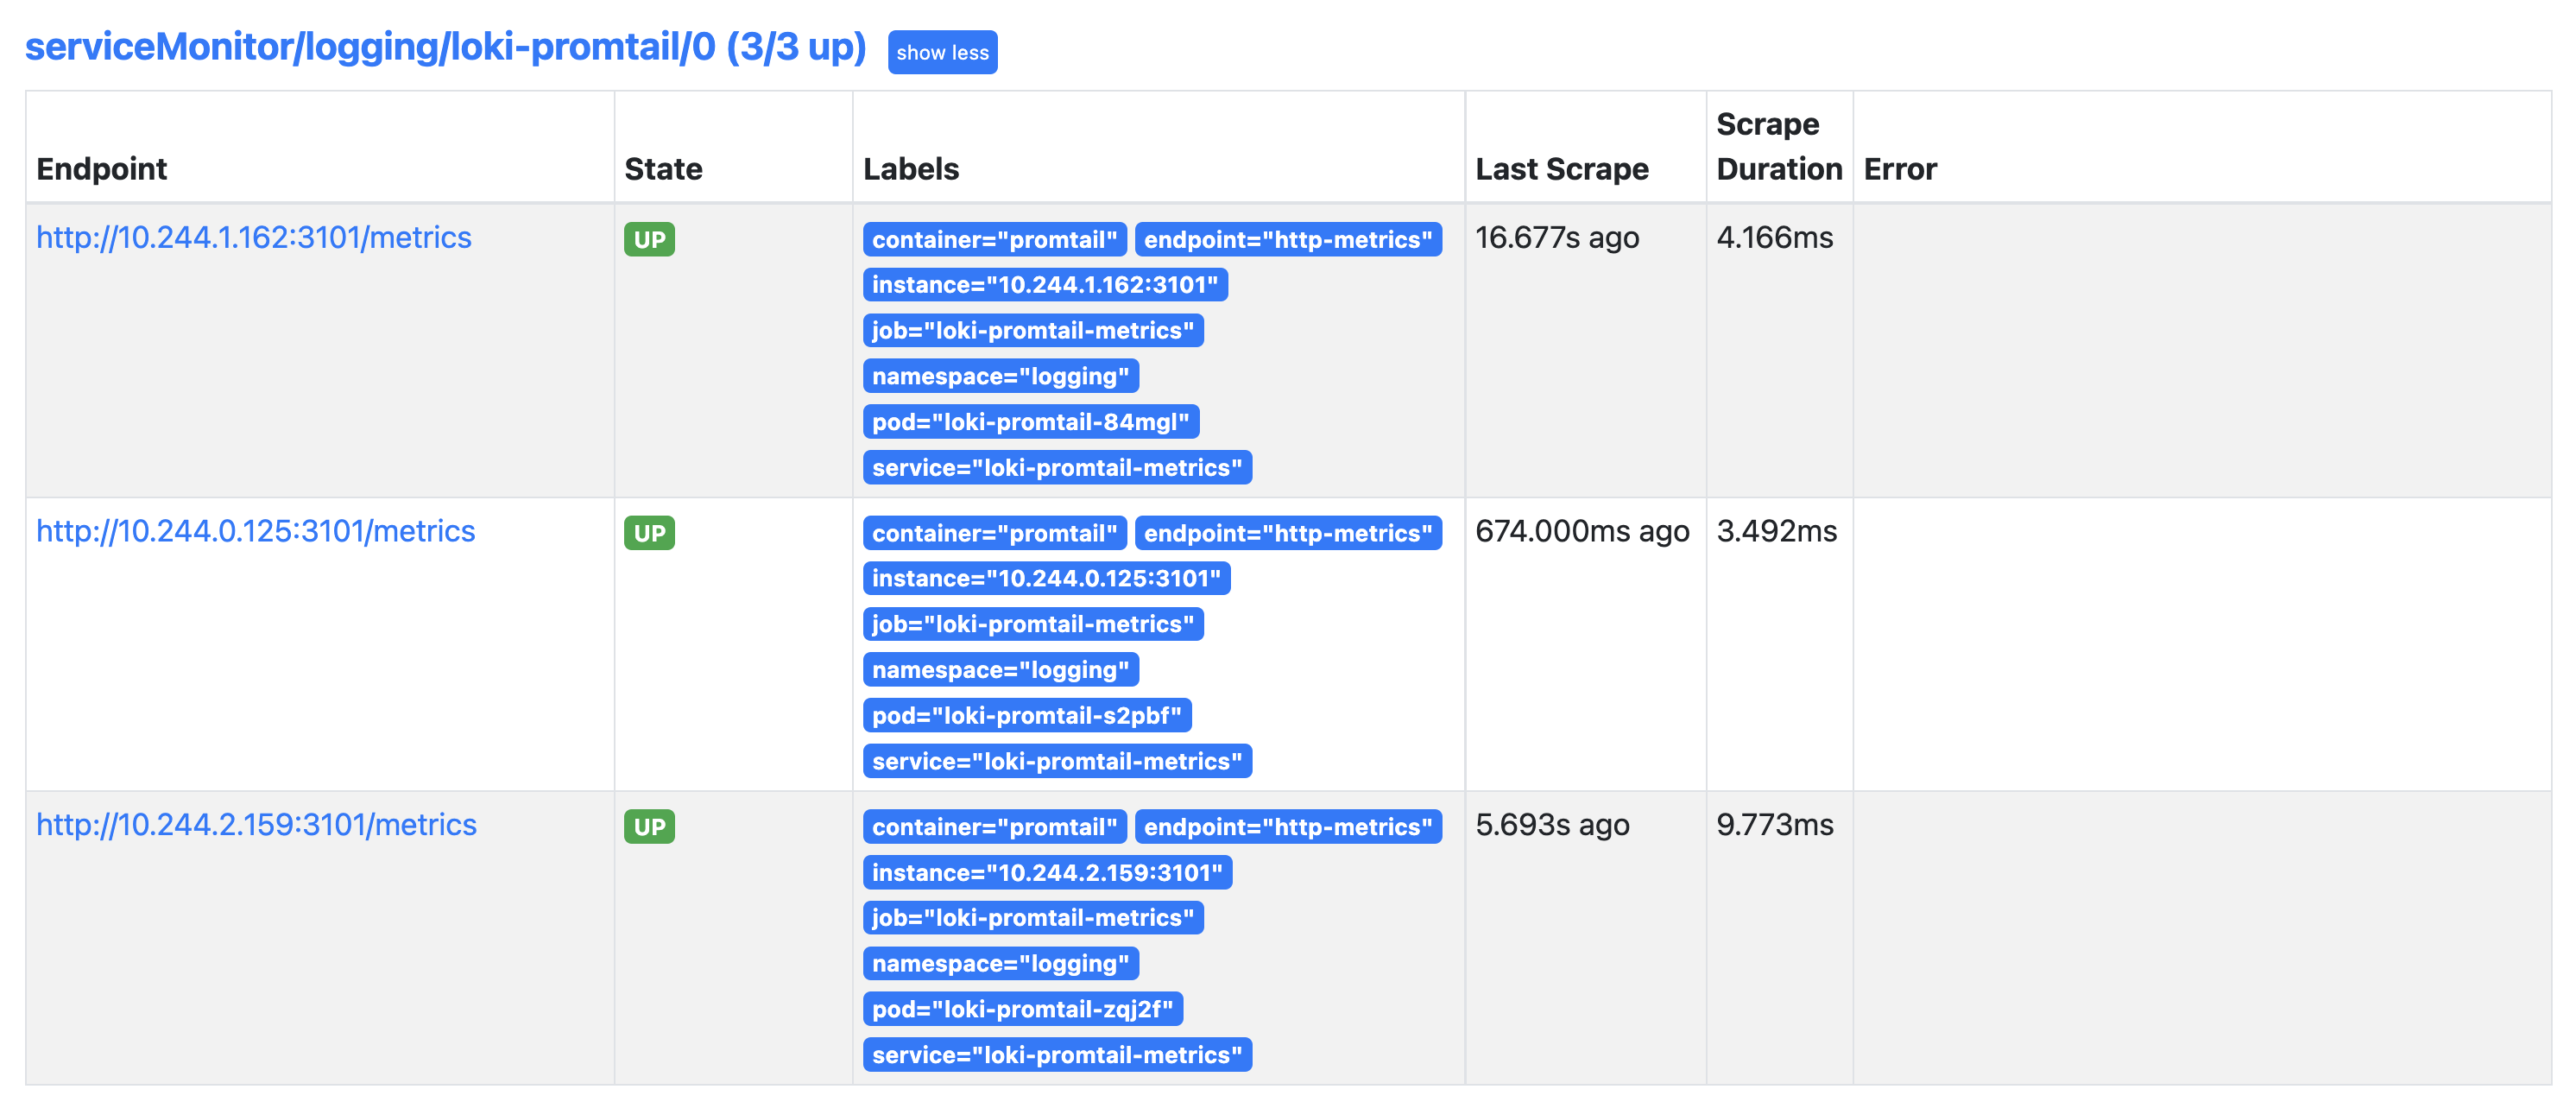
正常在 Prometheus 里面就可以看到 Promtail 的抓取目标了:
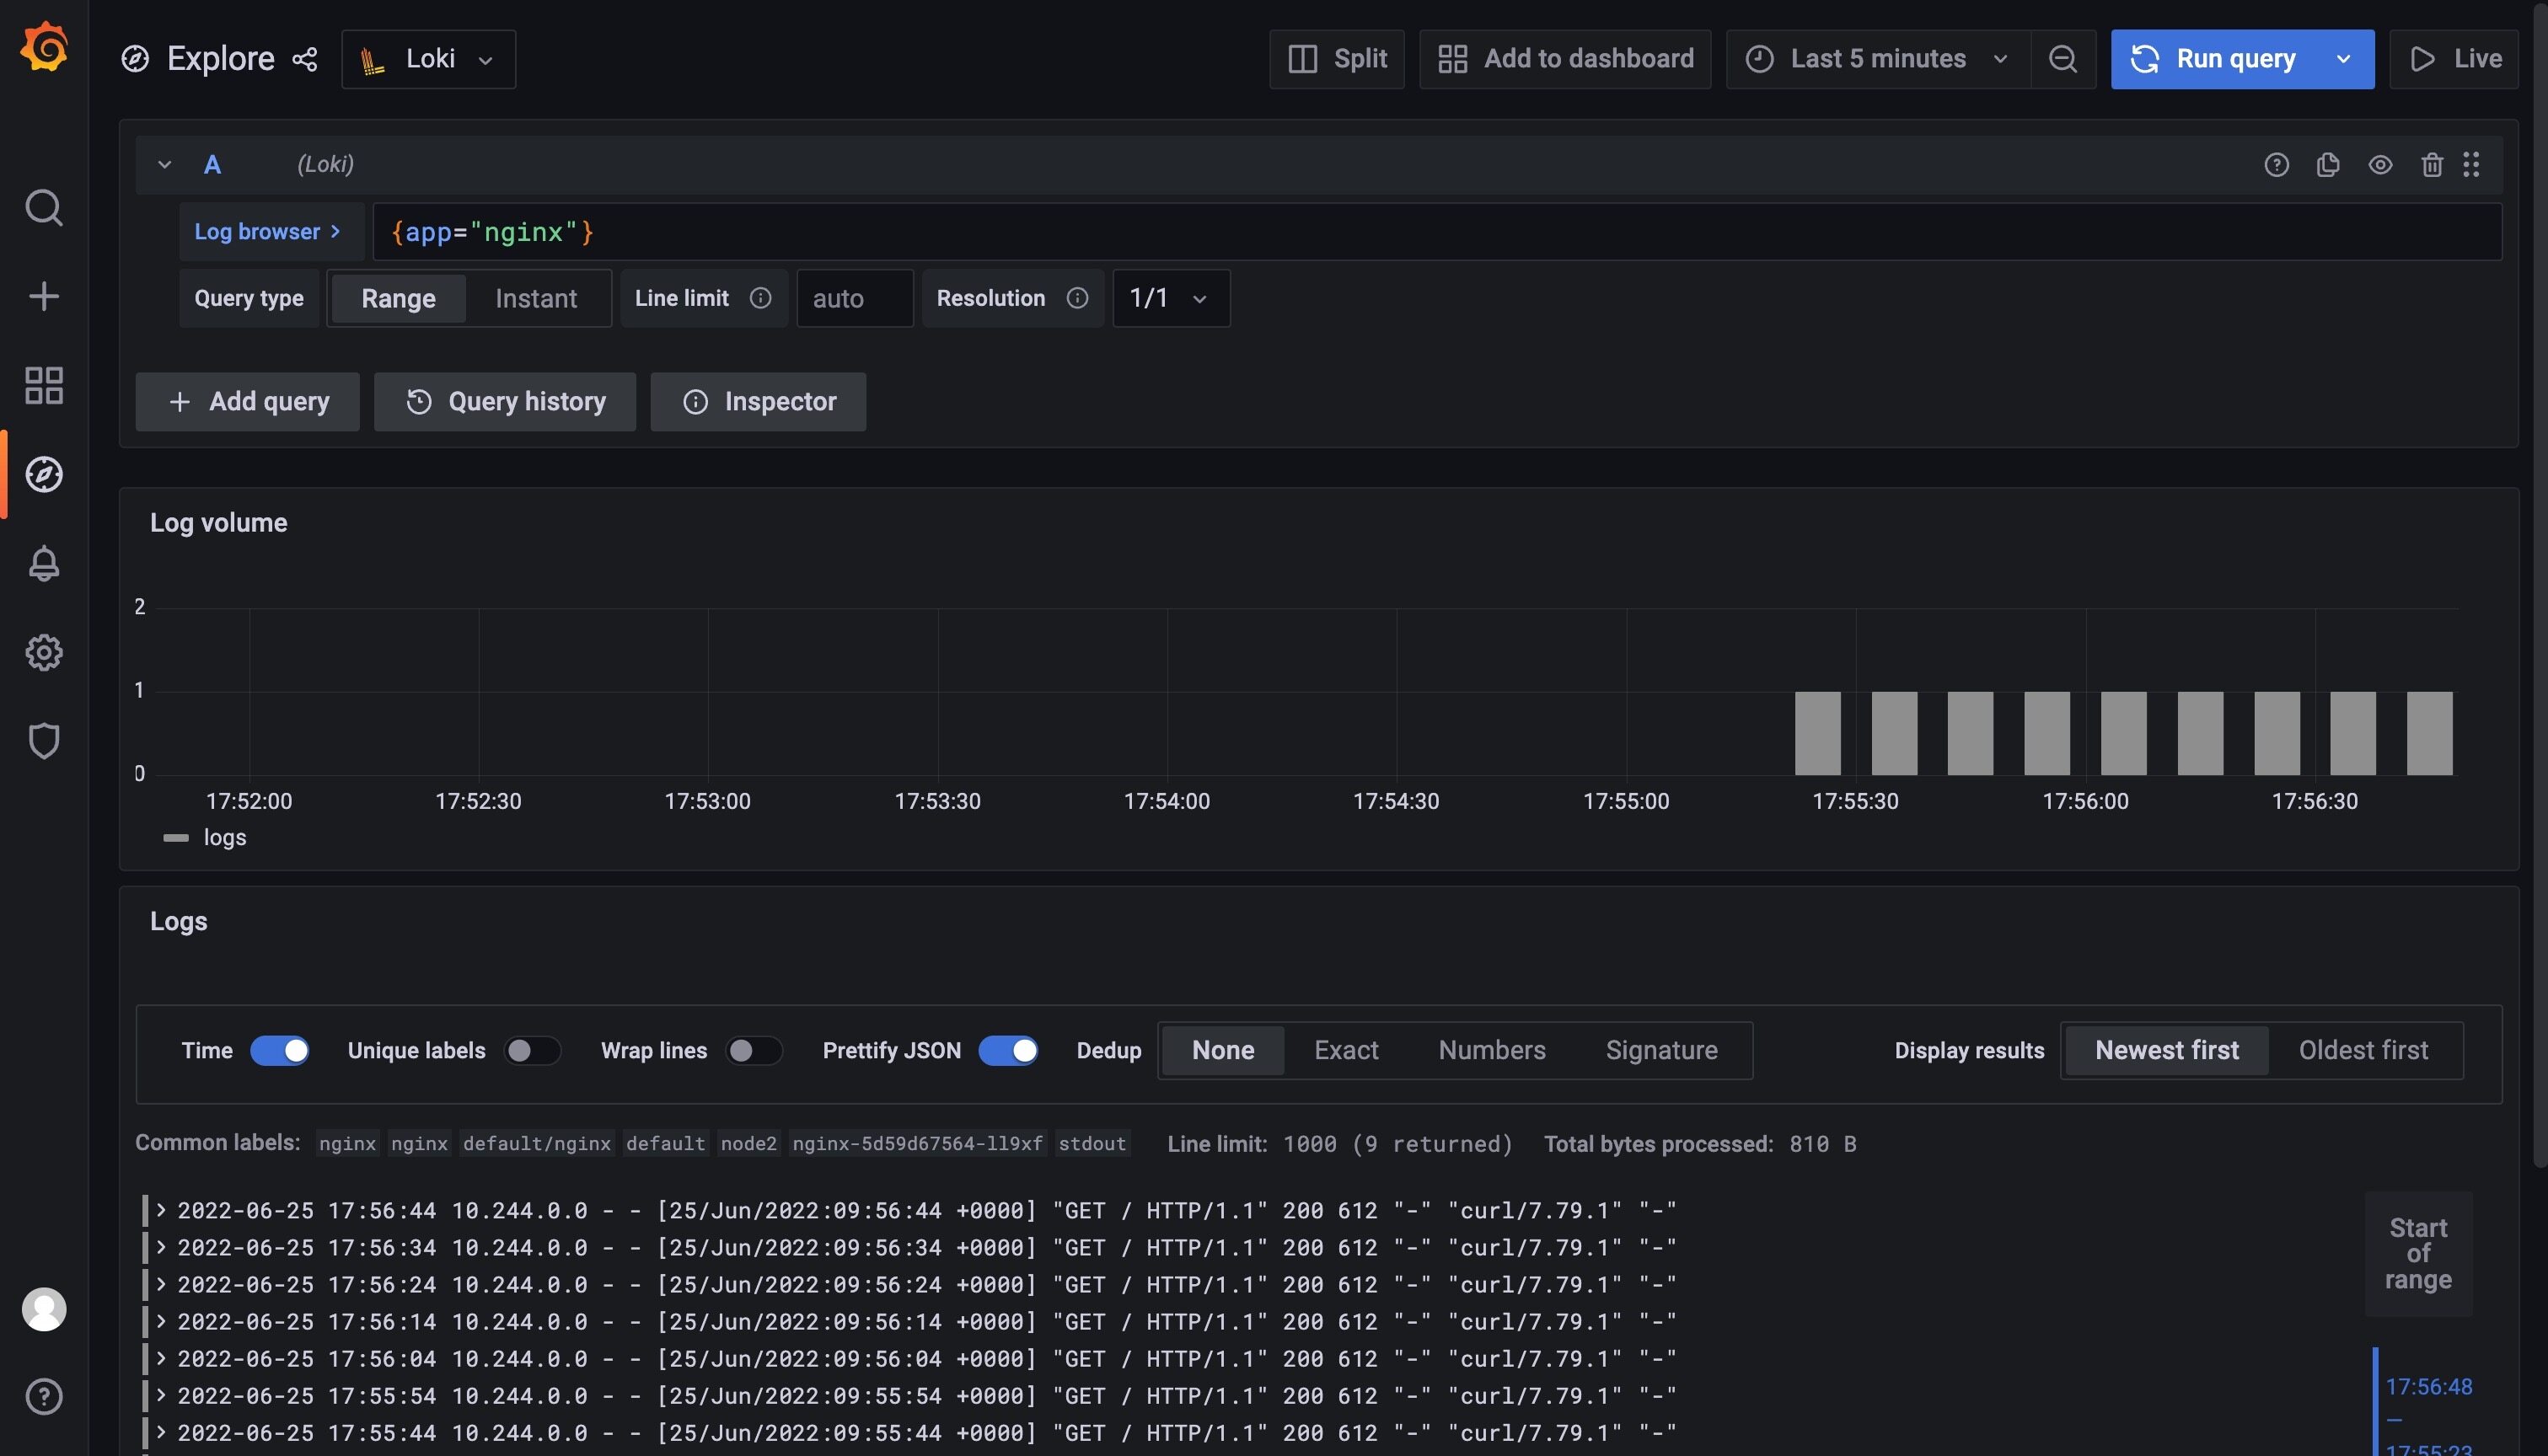
如果你使用的是 Prometheus Operator 自带的 Grafana,则需要手动添加上 Loki 的数据源,前面微服务模式中我们已经在 Grafana 中配置了 Loki 的数据源,现在当我们访问测试应用的时候,在 Loki 中是可以查看到日志数据的:
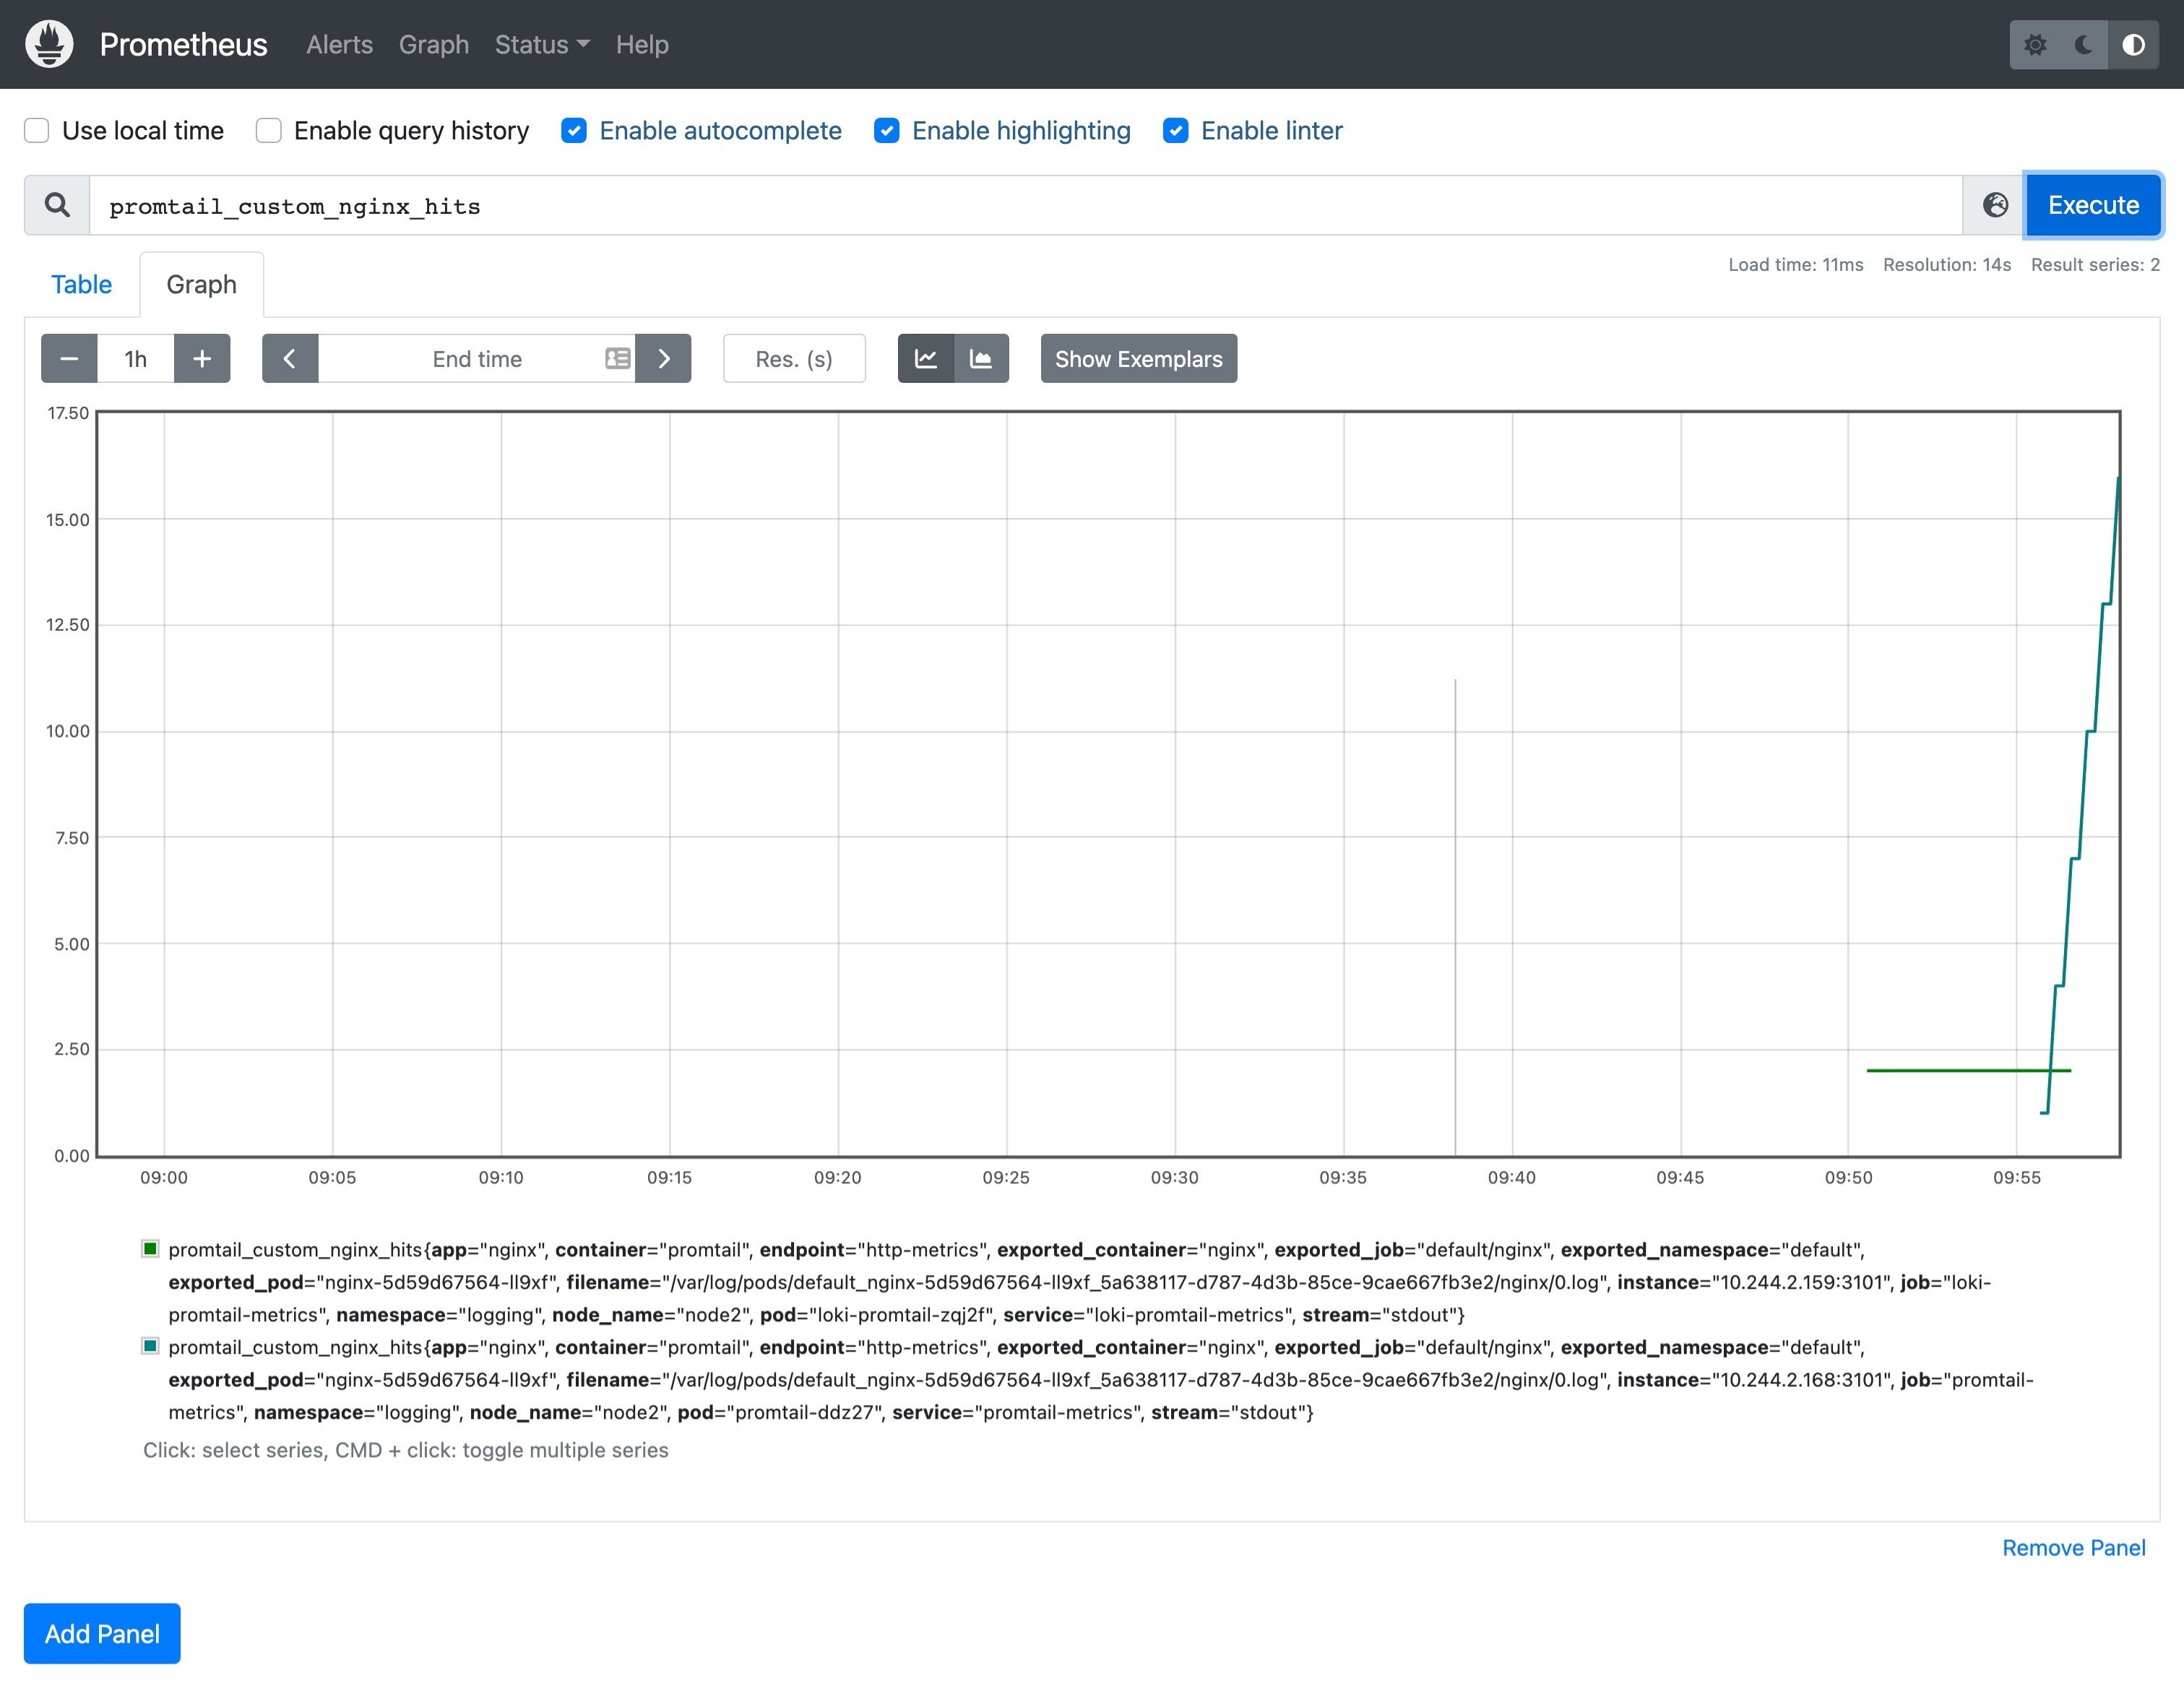
而且现在在 Prometheus 中还可以查询到我们在 Promtail 中添加的 metrics 指标数据:
因为现在已经有监控指标了,所以我们就可以根据需求来创建报警规则了,我们这里使用的 Prometheus Operator,所以可以直接创建一个 PrometheusRule 资源对象即可:
# nginx-prometheus-rule.yaml
apiVersion: monitoring.coreos.com/v1
kind: PrometheusRule
metadata:
  labels:
    prometheus: k8s
    role: alert-rules
  name: promtail-nginx-hits
  namespace: logging
spec:
  groups:
    - name: nginx-hits
      rules:
        - alert: LokiNginxHits
          annotations:
            summary: nginx hits counter
            description: 'nginx_hits total insufficient count ({{ $value }}).'
          expr: |
            sum(increase(promtail_custom_nginx_hits[1m])) > 2
          for: 2m
          labels:
            severity: critical
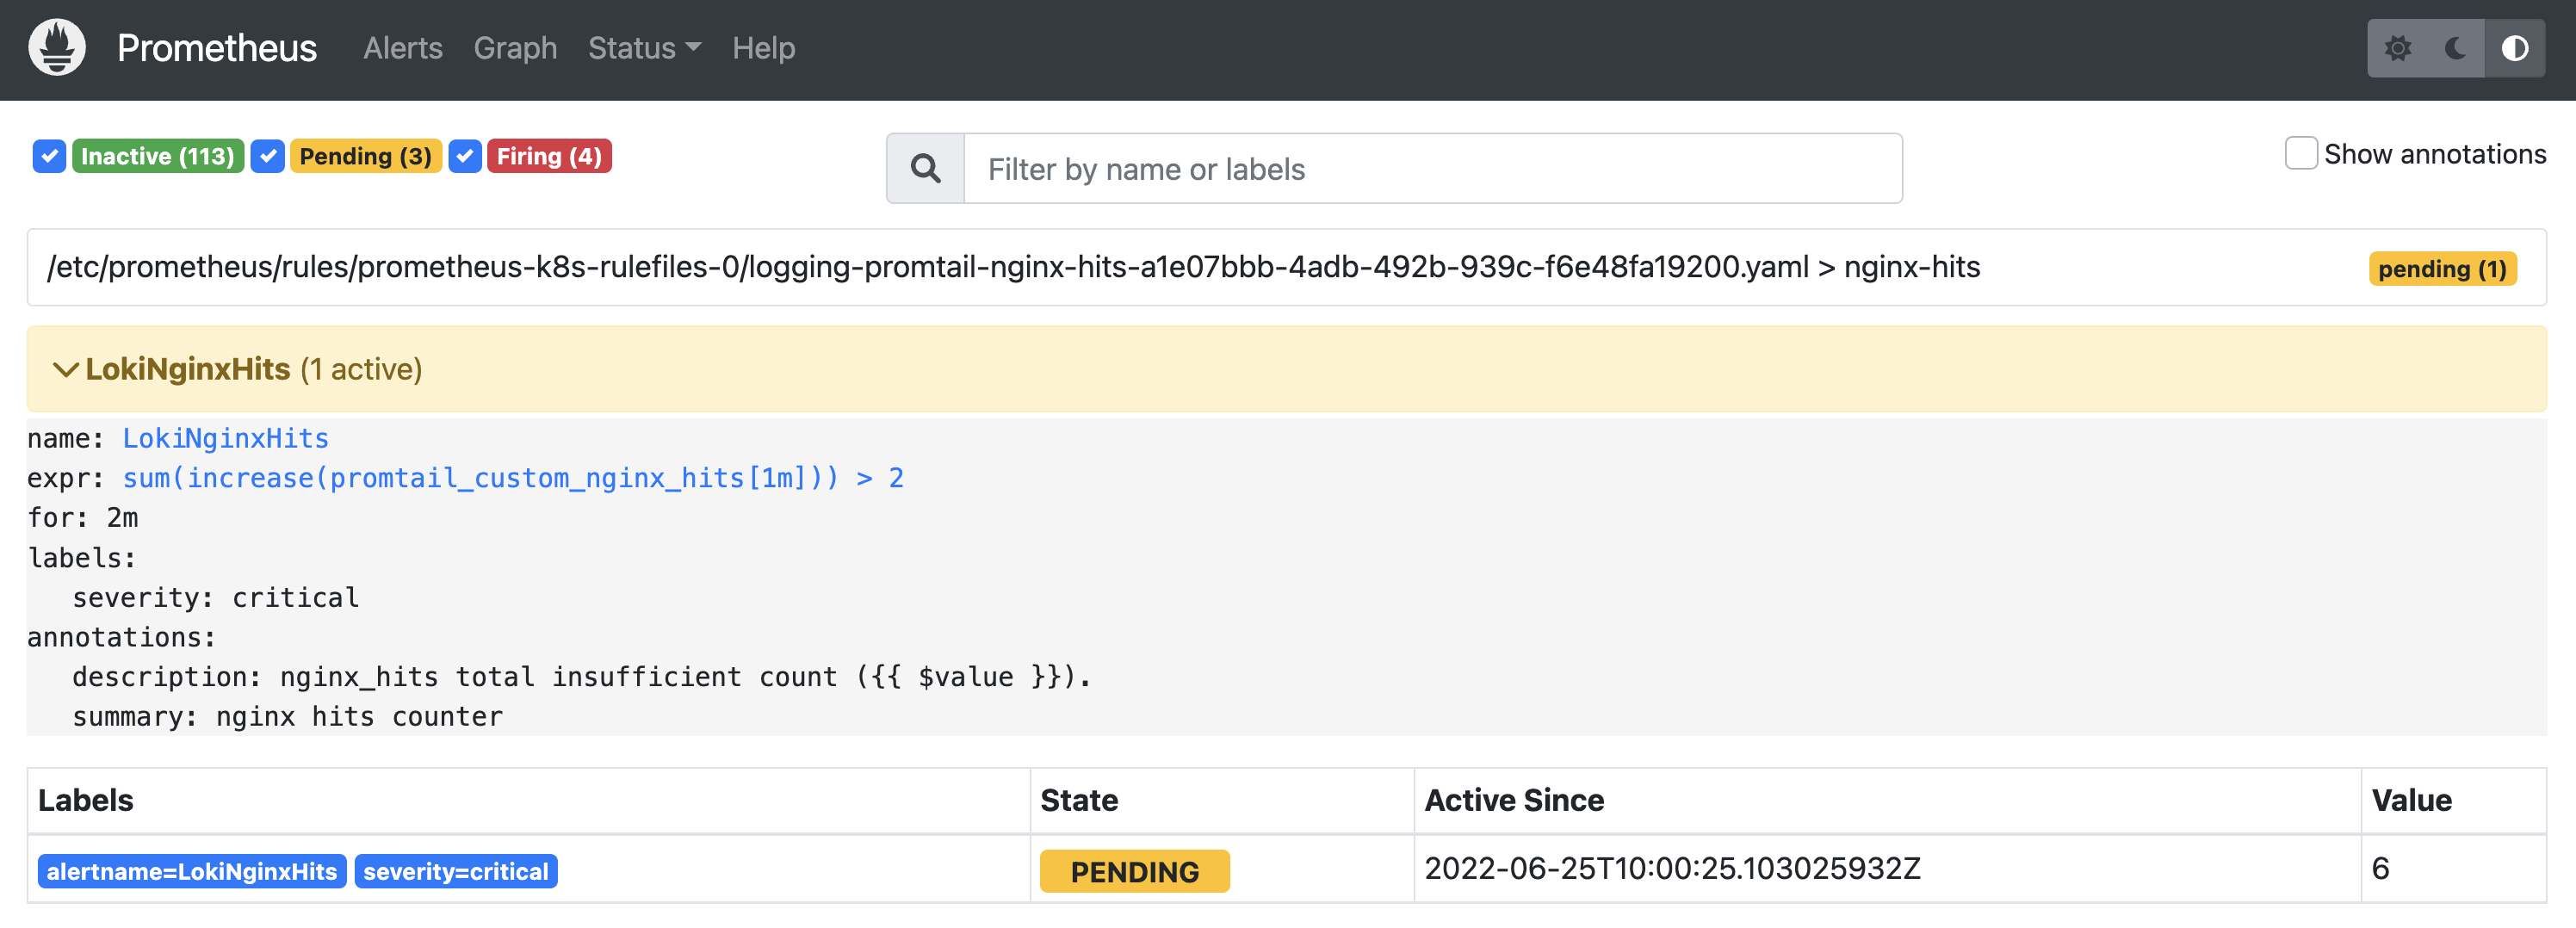
这里我们配置了名为 nginx_hits 的报警规则,这些规则在同一个分组中,每隔一定的时间间隔依次执行。触发报警的阈值通过 expr 表达式进行配置。我们这里表示的是 1 分钟之内新增的总和是否大于 2,当 expor 表达式的条件持续了 2 分钟时间后,报警就会真正被触发,报警真正被触发之前会保持为 Pending 状态。
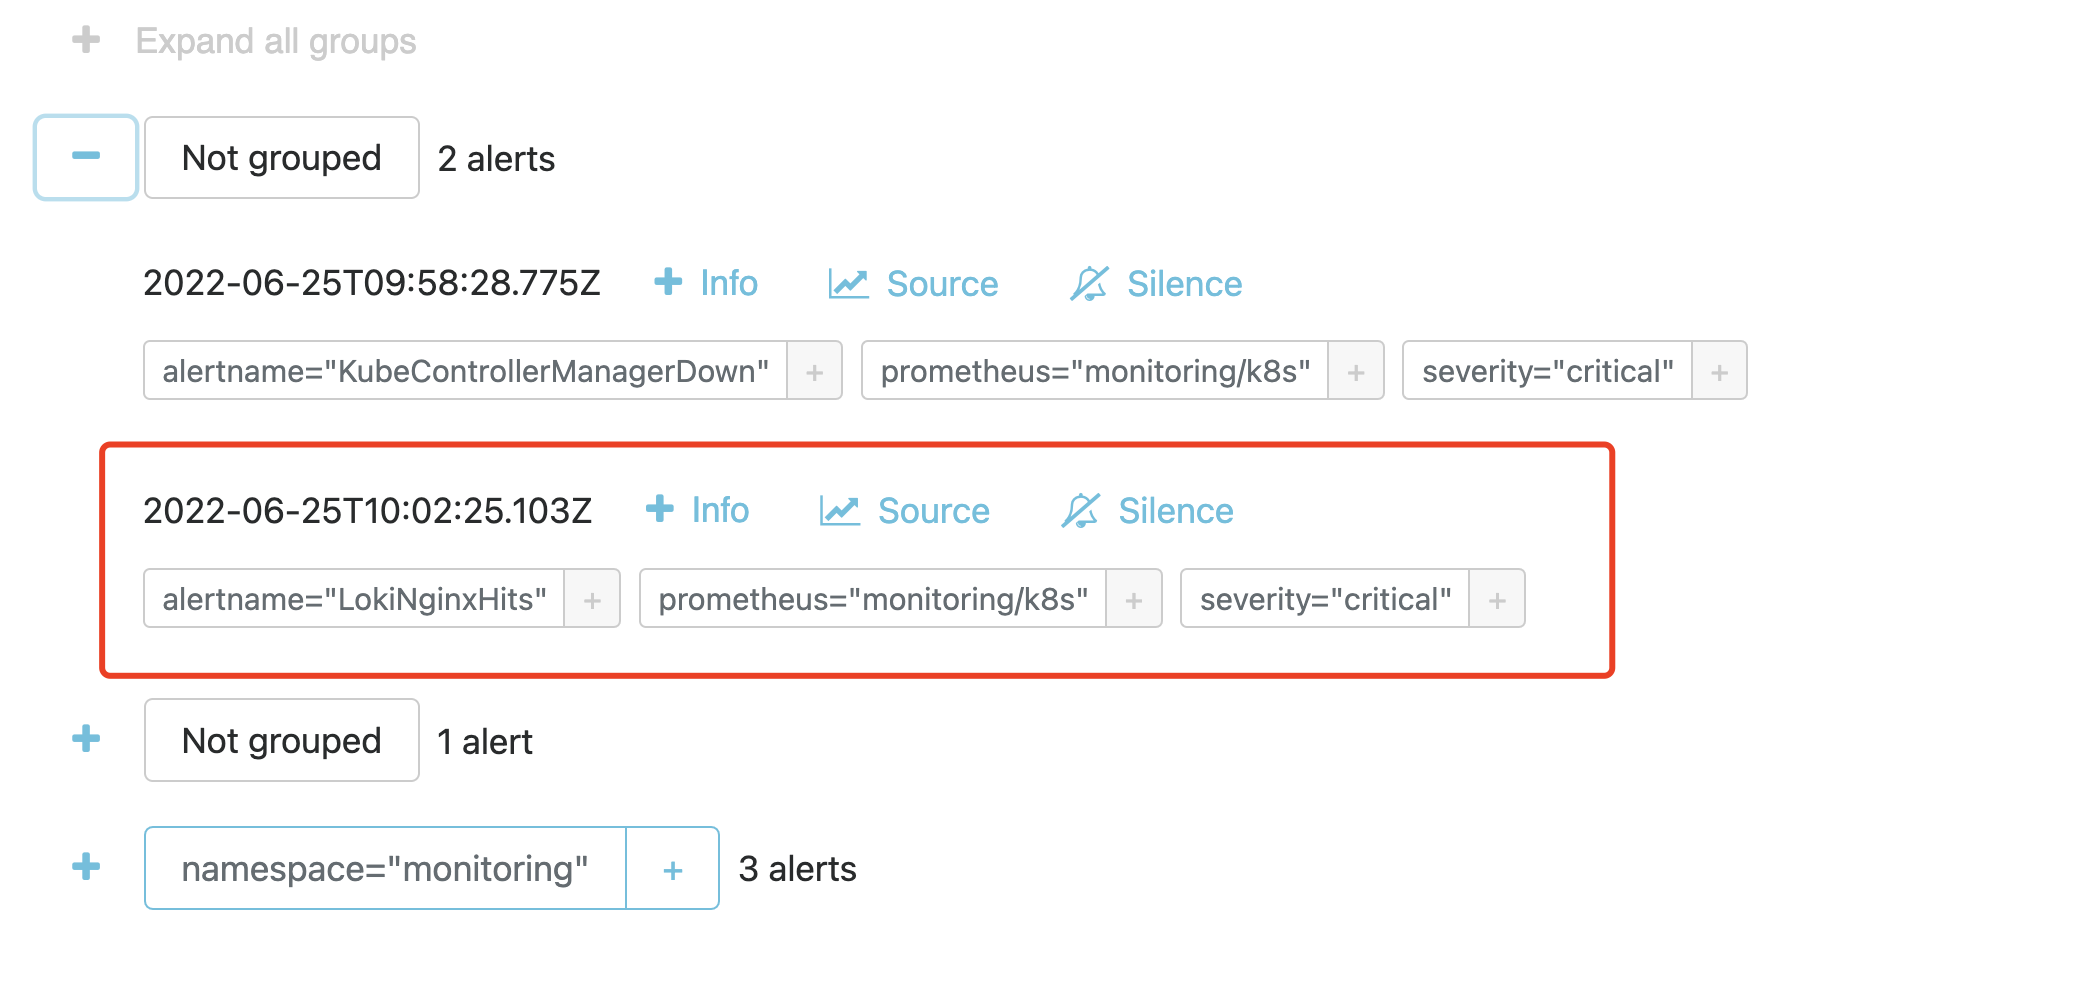
然后具体想要把报警发送到什么地方去,可以根据标签去配置 receiver,比如可以通过 WebHook 来接收。我们在 AlertManager 中也是可以看到接收到的报警事件的。
Ruler 组件
上面的方式虽然可以实现我们的日志报警功能,但是还是不够直接,需要通过 Promtail 去进行处理,那么我们能否直接通过 Loki 来实现报警功能呢?其实在 Loki2.0 版本就提供了报警功能,其中有一个 Ruler 组件可以持续查询一个 rules 规则,并将超过阈值的事件推送给 AlertManager 或者其他 Webhook 服务,这也就是 Loki 自带的报警功能了,而且是兼容 AlertManager 的。
首先我们需要开启 Loki Ruler 组件,更新 loki-distributed 安装的 Values 文件,在前面微服务模式的基础上增加 ruler 组件配置:
# ci/alert-values.yaml
loki:
  structuredConfig:
    ingester:
      max_transfer_retries: 0
      chunk_idle_period: 1h
      chunk_target_size: 1536000
      max_chunk_age: 1h
    storage_config: # 存储的配置,定义其他组件可能用到的存储
      aws: # s3 / s3 兼容的对象存储
        endpoint: minio.logging.svc.cluster.local:9000
        insecure: true
        bucketnames: loki-data
        access_key_id: myaccessKey
        secret_access_key: mysecretKey
        s3forcepathstyle: true
      boltdb_shipper:
        shared_store: s3
    schema_config:
      configs:
        - from: 2022-06-21
          store: boltdb-shipper # index
          object_store: s3 # chunks
          schema: v12
          index:
            prefix: loki_index_
            period: 24h
    ruler:
      storage:
        type: local
        local:
          directory: /etc/loki/rules
      ring:
        kvstore:
          store: memberlist
      rule_path: /tmp/loki/scratch
      alertmanager_url: http://alertmanager-main.monitoring.svc.cluster.local:9093
      external_url: http:/192.168.0.106:31918

distributor:
  replicas: 2

ingester: # WAL(replay)
  replicas: 2
  persistence:
    enabled: true
    size: 1Gi
    storageClass: local-path

querier:
  replicas: 2
  persistence:
    enabled: true
    size: 1Gi
    storageClass: local-path

queryFrontend:
  replicas: 2

gateway: # nginx容器 -> 路由日志写/读的请求
  nginxConfig:
    httpSnippet: |-
      client_max_body_size 100M;
    serverSnippet: |-
      client_max_body_size 100M;

# Configuration for the ruler
ruler:
  enabled: true
  kind: Deployment
  replicas: 1
  persistence:
    enabled: true
    size: 1Gi
    storageClass: local-path
  # -- Directories containing rules files
  directories:
    tenant_no:
      rules1.txt: |
        groups:
          - name: nginx-rate
            rules:
            - alert: LokiNginxRate
              expr: sum(rate({app="nginx"} |= "error" [1m])) by (job)
                    /
                  sum(rate({app="nginx"}[1m])) by (job)
                    > 0.01
              for: 1m
              labels:
                severity: critical
              annotations:
                summary: loki nginx rate
                description: high request latency
我们首先通过 loki.structuredConfig.ruler 对 Ruler 组件进行配置,比如指定 Alertmanager 的地址,规则存储方式等,然后通过 ruler 属性配置了组件的相关信息以及报警规则,重新使用上面的 values 文件安装 Loki:
$ helm upgrade --install loki -n logging -f ci/alert-values.yaml .
$ kubectl get pods -n logging
NAME                                                   READY   STATUS    RESTARTS      AGE
grafana-55d8779dc6-gkgpf                               1/1     Running   2 (66m ago)   3d21h
loki-loki-distributed-distributor-56959cc548-xpv6d     1/1     Running   0             3m36s
loki-loki-distributed-distributor-56959cc548-zjfsb     1/1     Running   0             2m52s
loki-loki-distributed-gateway-6f4cfd898c-p9xxf         1/1     Running   0             21m
loki-loki-distributed-ingester-0                       1/1     Running   0             2m32s
loki-loki-distributed-ingester-1                       1/1     Running   0             3m34s
loki-loki-distributed-querier-0                        1/1     Running   0             2m48s
loki-loki-distributed-querier-1                        1/1     Running   0             3m29s
loki-loki-distributed-query-frontend-5bcc7949d-brzg6   1/1     Running   0             3m30s
loki-loki-distributed-query-frontend-5bcc7949d-g2wwd   1/1     Running   0             3m35s
loki-loki-distributed-ruler-5d4b8cd889-m2vbd           1/1     Running   0             3m35s
minio-548656f786-mjd4c                                 1/1     Running   2 (66m ago)   3d21h
promtail-ddz27                                         1/1     Running   0             19m
promtail-lzr6v                                         1/1     Running   0             20m
promtail-nldqx                                         1/1     Running   0             20m
Loki 的 rulers 规则和结构与 Prometheus 是完全兼容,唯一的区别在于查询语句(LogQL)不同,在 Loki 中我们用 LogQL 来查询日志,一个典型的 rules 配置文件如下所示:
groups:
  # 组名称
  - name: xxxx
    rules:
      # Alert名称
      - alert: xxxx
        # logQL查询语句
        expr: xxxx
        # 产生告警的持续时间 pending.
        [ for:  | default = 0s ]
        # 自定义告警事件的label
        labels:
        [ :  ]
        # 告警时间的注释
        annotations:
        [ :  ]
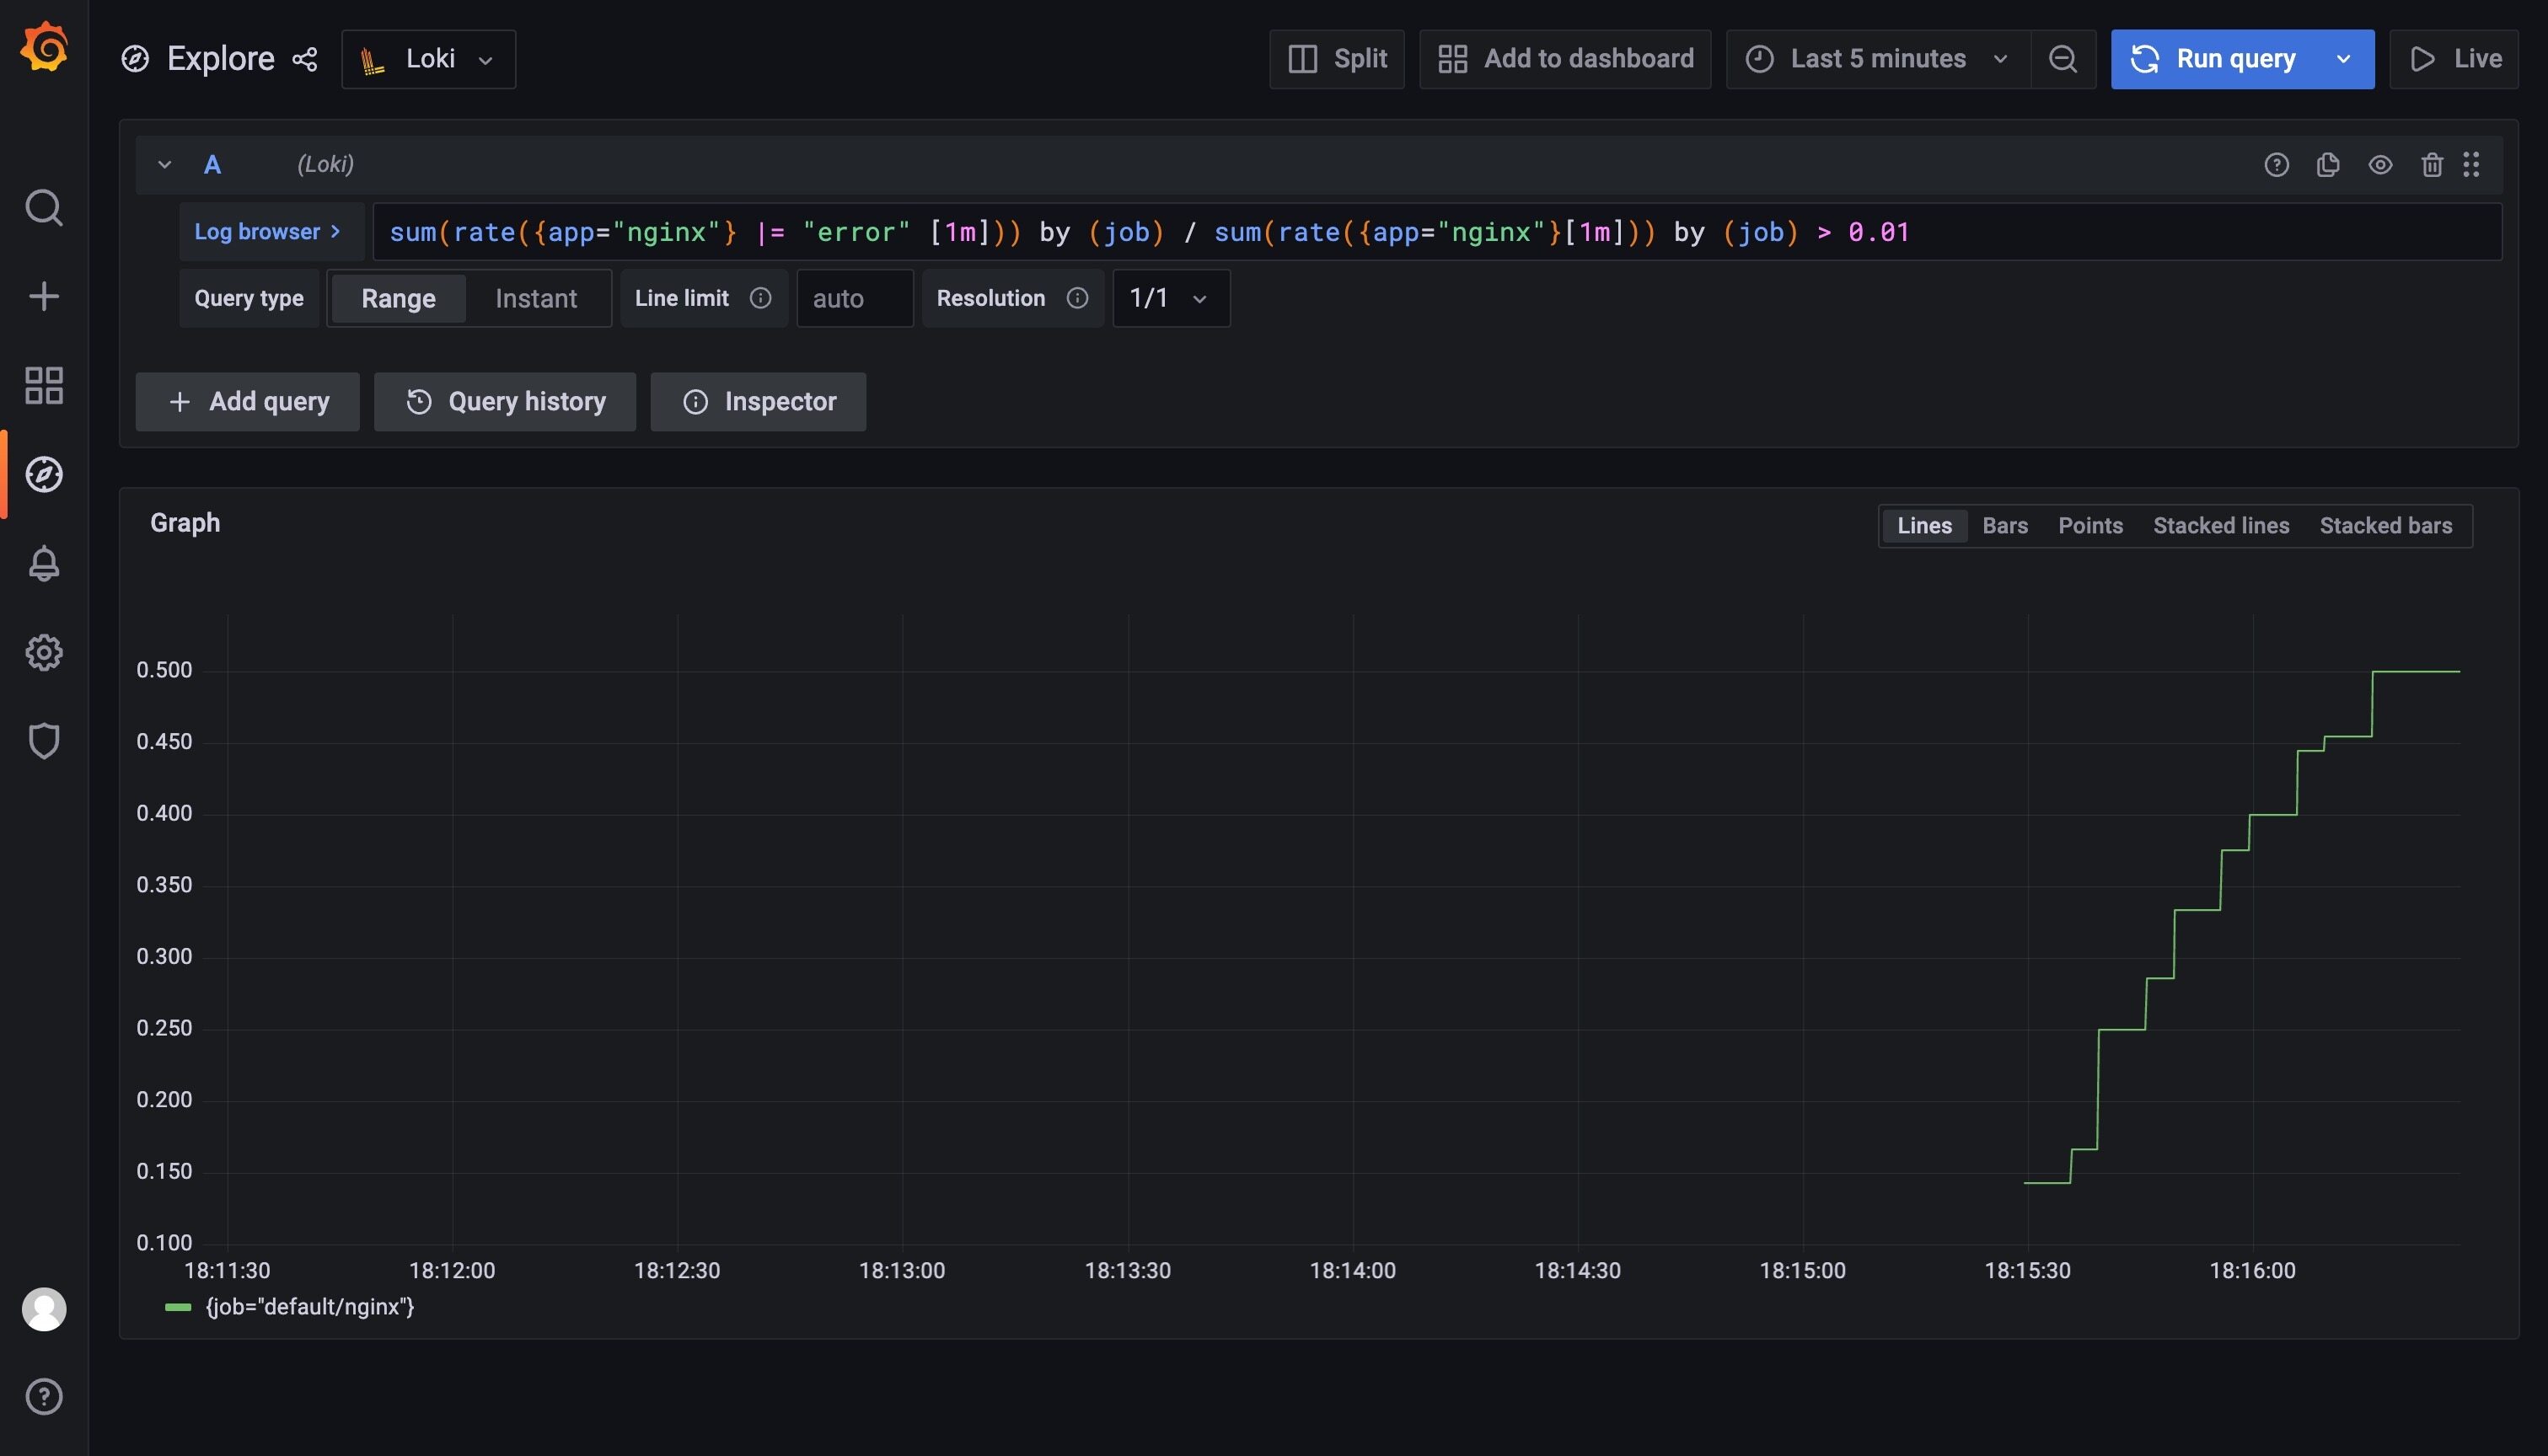
比如我们这里配置的规则 sum(rate({app="nginx"} |= "error" [1m])) by (job) / sum(rate({app="nginx"}[1m])) by (job) > 0.01 表示通过日志查到 nginx 日志的错误率大于 1%就触发告警,同样重新使用上面的 values 文件更新 Loki:
更新完成后我们查看 Ruler 组件的日志可以看到一些关于上面我们配置的报警规则的信息:
$ kubectl logs -f loki-loki-distributed-ruler-5d4b8cd889-m2vbd -n logging
......
level=info ts=2022-06-25T10:10:07.445554993Z caller=metrics.go:122 component=ruler org_id=tenant_no latency=fast query="((sum by(job)(rate({app=\"nginx\"} |= \"error\"[1m])) / sum by(job)(rate({app=\"nginx\"}[1m]))) > 0.01)" query_type=metric range_type=instant length=0s step=0s duration=25.306079ms status=200 limit=0 returned_lines=0 throughput=0B total_bytes=0B queue_time=0s subqueries=1
level=info ts=2022-06-25T10:11:03.196836972Z caller=pool.go:171 msg="removing stale client" addr=10.244.2.165:9095
level=info ts=2022-06-25T10:11:07.423644116Z caller=metrics.go:122 component=ruler org_id=tenant_no latency=fast query="((sum by(job)(rate({app=\"nginx\"} |= \"error\"[1m])) / sum by(job)(rate({app=\"nginx\"}[1m]))) > 0.01)" query_type=metric range_type=instant length=0s step=0s duration=3.234499ms status=200 limit=0 returned_lines=0 throughput=0B total_bytes=0B queue_time=0s subqueries=1
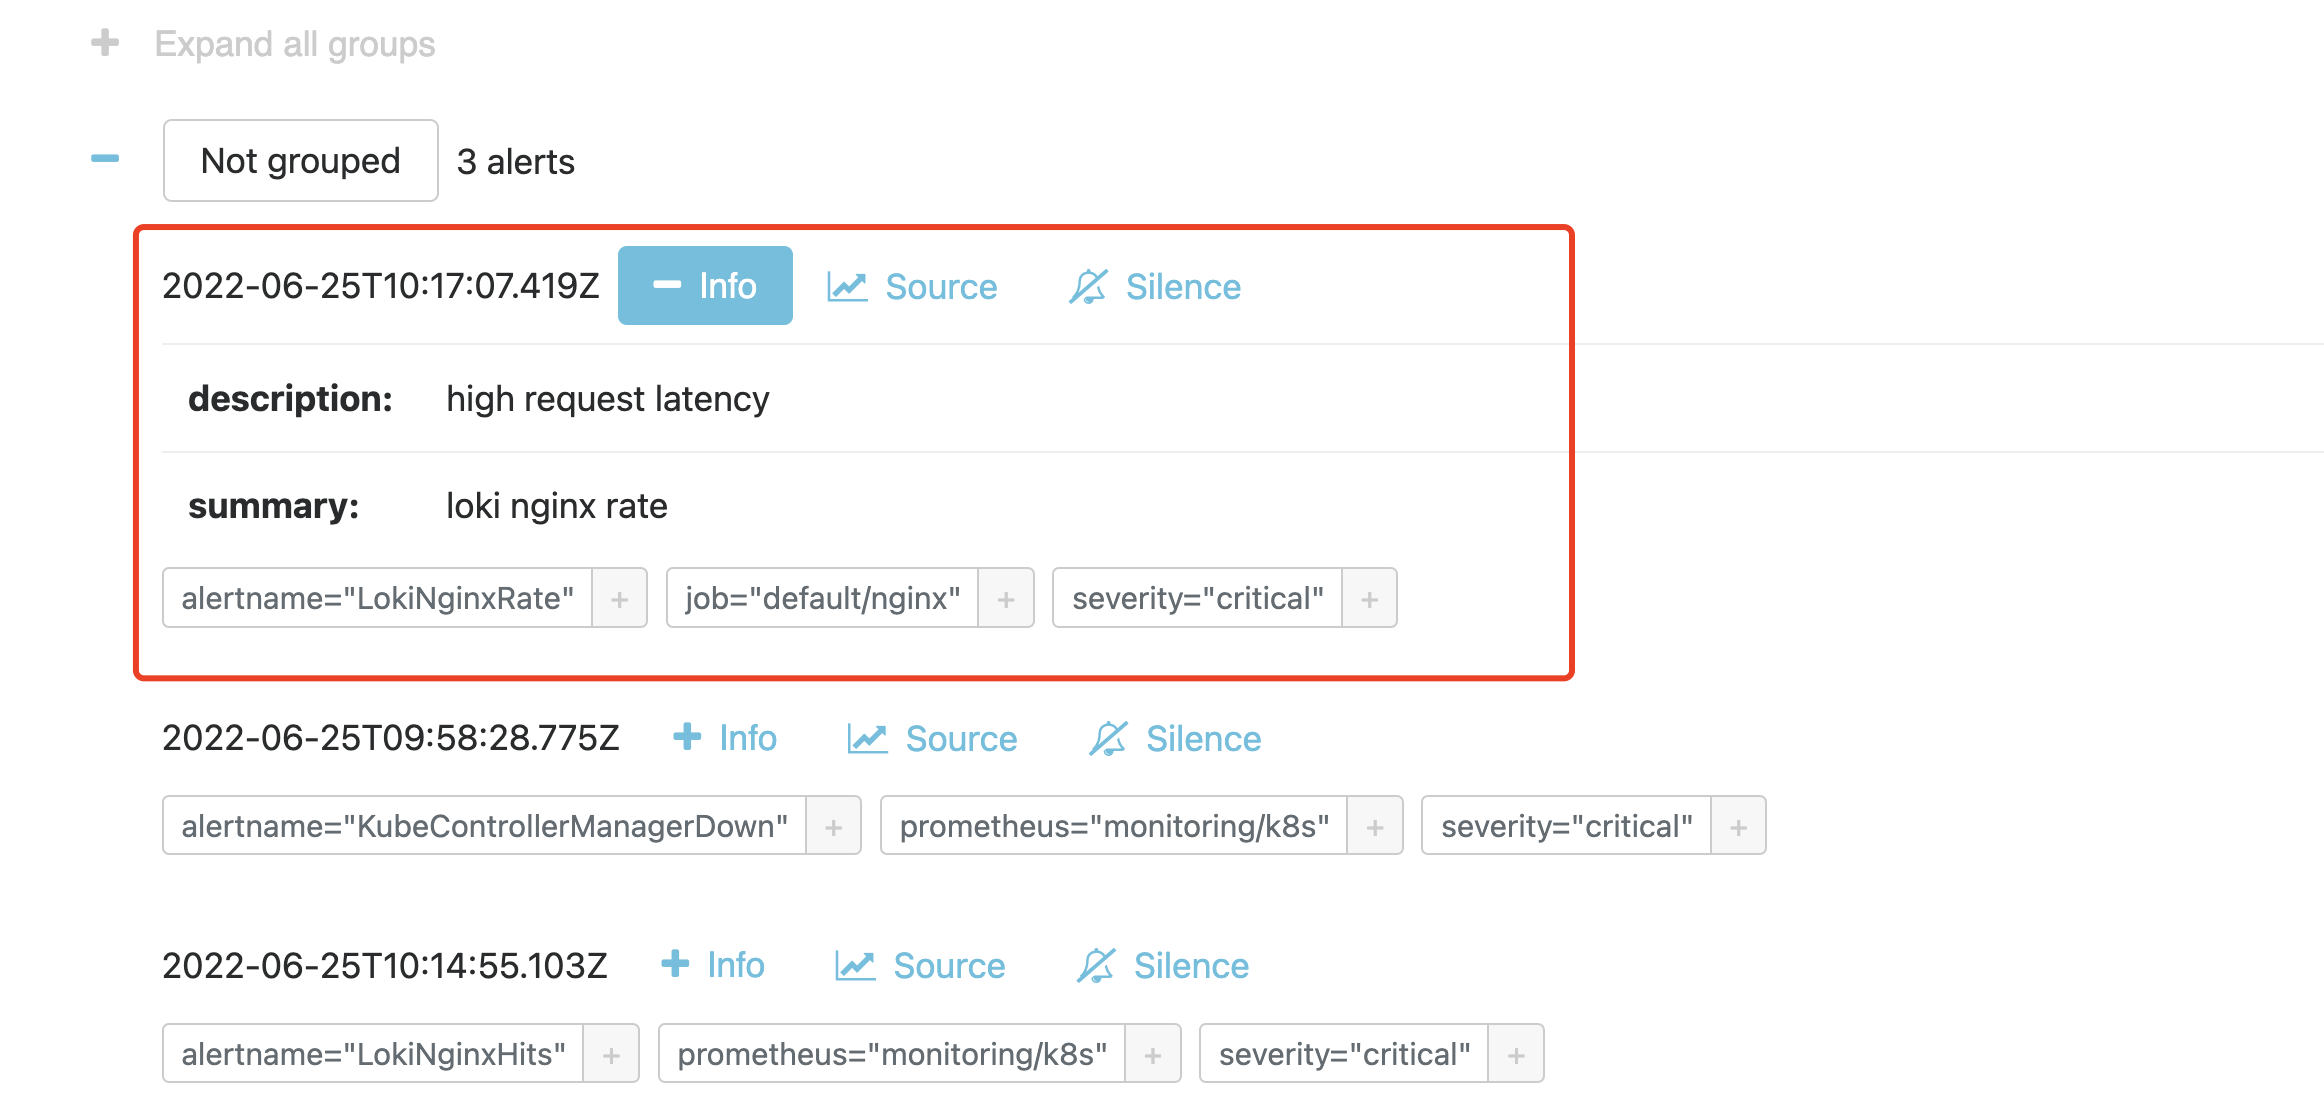
同样在 1m 之内如果持续超过阈值,则会真正触发报警规则,触发后我们在 Alertmanager 也可以看到对应的报警信息了:
到这里我们就完成了使用 Loki 基于日志的监控报警。